First of all, however, let’s look at the basics of log files, how to obtain them, and what challenges they present.
What is a log file?
A log file is a file output contained within a web server that records any request that the server receives. It is useful to investigate log files to see what resources are crawling a website.
Every time a user or a crawler visits a website, a bunch of recordings is entered into the log file. Log files exist for example for technical auditing, error handling and troubleshooting, but as many SEOs will tell you, they are also extremely useful as part of any thorough and in-depth SEO technical audit. A single page load enters a line for every resource request on that page. So depending on resource calls that is the amount of lines log gets. If browser cache is in use some resources might be loaded locally after initial load.
The reason behind this is because log files offer webmasters true records of how users, bots, and crawlers interact with a website. Suites such as Search Console and third-party software cannot provide entire or accurate pictures of the entities that interact with a website.
Anatomy of a log file
The structure and individual components of a log file depend on a variety of factors, including the type of server in question and other configurations.
There are, however, common factors found within log files. Typically, you will expect to see the following:
- Client/Visitor IP
- Timestamp
- Method (GET/POST)
- Requested URL
- HTTP status code
- Browser user-agent

(This is an example and the actual order of this structure may vary)
Other information that is generally, but not always available, include:
- Hostname
- Request/Client IP
- Bytes downloaded
- Time taken to load the resource from server to client
How can you get access to log files?
How you access your log files depends entirely on how your server is set up.
These days one of the most common ways of getting access logs is getting them from a CDN provider. Like CloudFlare, CloudFront etc. You need to get the logs from the closest endpoint between the server/service serving your content/resources and client. In many cases that is the CDN. If CDN is in use, access logs from the webserver give nearly nothing as it gets hits only if the cache is purged.
On top, you have web servers. The three most common types of web servers are Apache, NGINX, IIS. Common CDN providers are for example Cloudflare, Sucuri, Kinsta CDN, Netlify CDN and Amazon CloudFront.
If you have never accessed your server files before, getting to them can be difficult. You will also need to know what type of log you are searching for, such as an error log or an access log.
Providing detailed explanations of how to access these for each type of server is an article for another day, but below are three official guides to accessing log files on the three different server types:
- How to access Apache access log files (Linux)
- How to access NGINX access log files (Linux)
- How to access IIS access log files (Windows)
What are the challenges in getting the log files?
Since obtaining server files is a cumbersome task, for those with a lack of experience or technical knowledge, getting them can be excruciatingly difficult.
Besides this, however, there are also several other reasons that a person may find it challenging to get log files.
For instance, IIS servers are often used by legacy systems, which can be the case for when larger companies have long-running server contracts with Microsoft.
This means that webmasters who inherit legacy systems may need to refresh their knowledge of older software.
Another issue, if you are working with a client, is that the client may not understand or appreciate the importance of log files, which means that they could be hesitant to provide access or to obtain them themselves. Or they might’ve just simply disabled the logs as unnecessary, which means there is no historical data.
And logging needs to be enabled.
Quite often, SEOs will have to go through a myriad of departments or stakeholders to obtain or access more technical information or data.
These complications can often make log file analysis more difficult and frustrating for SEOs, despite the issues having little or nothing to do with the investigation itself.
I wanted to explore some of the challenges SEOs faced in obtaining log files, so I asked the Twitter SEO community for their experiences.
It’s fair to say that the Tweet blew up and I had so many great SEOs respond. Both Giana’s and Lyndon’s tweets pretty much sum up the problems around getting hold of log files.
Here is a summary of other issues raised.
1. PII (Personally identifiable information) – PII seems like a big enough concern for many organizations, and it’s easy to see why. Recent changes to GDPR and compliance means that businesses are reluctant to deal with anything remotely PII. But log files don’t always carry PII, and it’s easy to strip out this information from the logs. So, with the right education, it’s possible to convince the development and various stakeholders by highlighting the benefits of using log files.
A potential solution to this problem is to strip out any non-bot IP addresses as mentioned by Serge. I will show you how to do this easily using BigQuery.
Charly suggested another interesting point about using GET requests. But, it’s important to remember that Google does use POST requests.
Thomas gave a solid tip about compliance and PII as well.
2. The format/structure of the logs – The logs come in many different formats/data structures and some use compression to save space. So, when you’re using a tool to do the analysis, software often requires logs to be in a certain structure and charset. This is a pain point and not easy to resolve when we are talking about large file sizes.
I will show you how to solve this problem (or at least try), further in this article.
3. Log size and storage – This seems like the biggest problem faced by SEOs according to the thread. Numerous people mentioned this.
4. Convincing clients/companies to allow access to the logfiles – Obtaining access to files is a common problem I’ve noticed across the clients that I have personally worked with, and it takes a lot of effort to convince them that this is worth doing, so I totally agree with some of the comments here.
5. Platform limitations – Some platforms allow easy access to server logs. However, the majority of the platforms have little or no interest in providing access to logs as it rarely is in their scope. In large companies, there are multiple CRMs and accompanying systems; not all the log analyzing tools support every type of platform.
You can also sometimes overcome these through “Edge SEO”, Tag Manager or CDN Workers. Also, access logs are NOT and NEVER will be a platform problem. Nor a CRM. Always is a web server/CDN problem, which is platform agnostic.
This comment from Chris resonated with me because this entire article is based on this problem I had.
6. Accuracy of the data – Accuracy is not an actual problem. It’s there, you just need to have the ability to shift through the noise.
Even Though this might be a problem for some. But, Doing reverse DNS check on mass is not that difficult and can be completely automated.
Simon made some incredible points as well. According to his observations, Googlebot is used to do Google shopping validation, and if this is accurate (I believe him), the accuracy of the actual bot visit cannot be determined.
Although there are no official sources on this it’s easy to see why it’s a very valid point.
7. CDN – Most websites utilize CDN networks for speed and security. It can be a problem for log collection as assets can be served from different CDNs. Also as I mentioned previously the access logs need to be gathered from the “closest endpoint to the visitor” which is in many cases the CDN. With several pipelines, it is wise to have a normalized stream of logs merged into a single place for analyzing.
Why log file analysis is important for SEO?
There are several benefits for conducting a log file analysis for SEO, and it can provide you with a greater overall picture of how your website is performing and interacting with other entities on the internet.
For instance, by conducting a thorough and in-depth analysis, you can discover whether your crawl budget is spent efficiently, whether crawlers encounter deadends and bottlenecks, and if there are areas of crawl deficiency.
From the information gathered from the analysis, you can make the necessary improvements to your site, enabling it to perform better in organic search.
What are some SEO use cases?
Let’s take a more in-depth look to see how a log file analysis can be used. This list is not exhaustive, but these are some of the more common use cases for SEOs.
- Manage crawl budget
- Fix status code errors
- Verify whether your site has switched to the Mobile-First Index
- Prioritize your crawl
- Manage your crawl frequency
Analyze crawl budget
Not to be confused with crawl rate, crawl budget is an established term for the number of pages that a bot is able to crawl across a period of time — which usually stands as a single day.
The budget applied to a website can depend on many factors, but largely it will depend on the website’s frequency of publishing new and/or updating old content and ease of crawl.
It is important, therefore, that your crawl budget is spent on the right pages. For instance, if the bot gets bored and leaves your site after around 2,000 pages, you do not want that budget spent on unnecessary areas of your website, such as internal scripts or redirected pages.
Although crawling is usually controlled through robots.txt files and meta-robots tags, there could still be gaps in your defences that let crawlers through to redundant pages.
Thankfully, log files will tell you which pages are crawled by search engine bots. If you’re unsure about a particular page, ask yourself whether Google or users will find anything useful from it.
Once you find pages that you want to omit from crawling, you can utilize robots.txt files to instruct search engine crawlers accordingly.
Fix status code errors
Another advantage of analyzing your log files is that you will be able to view any errors encountered by search engines. These differ from data in local crawlers like Screaming Frog and Sitebulb as these are the actual errors Gbot has encountered.
Status code errors can affect the organic performance of your website, so it is crucial to understand if and where search engine crawlers are encountering them.
For instance, if a crawler encounters a 500 Server Error, the site crawl will not only be impeded, but the affected pages could be lost from search engine indexes altogether.
If you see 500 Server Errors within your logs, and you don’t want to lose the pages from search engines, as a temporary fix, I suggest offering a 503 response, which will indicate that the server is temporarily unavailable for maintenance. The crawl, however, will resume at a later date.
Not all status code errors can harm your search performance. It is quite common, for instance, for websites to encounter 404 pages, which means that the page is no longer available.
If you unexpectedly discover a few of these in your logs, however, it could be worth checking the pages’ analytics to see whether you should offer 301 redirects to other pages.
You can learn more about HTTP status codes and what they mean in this very useful Wikipedia page.
Verify whether your site has switched to the Mobile-First Index
As of 1 July 2019, mobile-first indexing is enabled by default by all new websites (or ones previously unknown to Google).
For older websites, however, switching to mobile-first indexing is something that takes time. As Google itself said: “For older or existing websites, we continue to monitor and evaluate pages based on.”
A site on Google’s regular index should expect 80% of its crawling to be done through the desktop crawler, with the other 20% being conducted by the mobile crawler. This ratio should reverse if your site gets switched to the mobile-first index. Logs are a good place to verify this yourself. As we deal with a lot of data, validating it sometimes can be beneficial.
You’ll also get a notification in Google Search Console, and you will be able to view the difference within the Index Coverage report
Prioritize your crawl
If you have product pages or important supporting articles that aren’t crawled, you could be missing out on valuable traffic and conversions because this can mean that they aren’t getting into the web index either. In Googles’ eyes, these pages don’t simply exist as they are not discovered
Your log files can indicate how often URLs or directories are crawled by bots. It is important to remember, however, that URLs are crawled at different rates, and some might only get crawled once every six months.
Google does this to avoid overloading servers. If significant changes are made on a website, those are likely picked up relatively quickly.
If you want to prioritize some pages, however, you can set up crawl priority in your site’s XML sitemap. Google provides a great explanation of how to do this in its sitemap management support guide.
Manage your crawl frequency
Although Googlebot is the most well-known crawler, there is an untold number across the internet that might visit your site daily. This is particularly important if you want to appear in search engines used in certain countries.
For instance, Yandex is the search engine of choice in Russia, while Baidu is the most popular search engine in China.
If you find that your site does not receive visits by search engines that are important to your website, it could be time to check within your respective search console and find out why.
By taking a look at crawl frequency, which is closely related, you can also discover whether adding fresh content to your website increases the amount of time it is crawled by specific bots.
These are some of the standard use cases. However, the real fun begins when you start combining crawl data with your other data such as Google Analytics, Sitemap, and Google Search Console. When you are combining data however you HAVE to understand the caveats of different metrics from different sources. Very rarely metrics are compared directly between sources as the recording of them is different. Something to keep in mind.
Just knowing what pages are frequently crawled by Googlebot is cool, but if you take a step back and think about it, what is the actual use case of this? What if you can overlay your Google analytics product conversion data on top of the pages frequently crawled URLs?
I have built a Google Data Studio solution to show you how to do this further down the article.
JetOctopus has put together a 21 point checklist, and you might find it useful to read further about things you can do with log file analysis.
What logs files don’t tell you?
Although there is much to learn from a website’s log files, they are but only one piece to a vast and complex puzzle.
For instance, log files won’t — at least directly — tell you how your website is performing from the perspective of organic search.
There isn’t any kind of session nor demographics type of data. In logs, the data is “raw”, simple hits to each resource you have.
Neither will they indicate how well a website is performing in comparison to its business objectives.
For instance, the site may receive a lot of traffic, but its conversions may be agonizingly low.
If this is the case, you need to discover why, which is something you can piece together with a comprehensive SEO audit that includes log file analysis.
What are some of my favourite Logfile analyzers?
I have listed some of my favourite logfile analyzers below. Please note that I have no affiliation with any of the tools mentioned below and this post is not meant to promote any tools. Please do your due diligence and trial the tools before you sign up to any of the subscriptions.
(The list is not in any particular order)
1. JetOctopus Log Analyzer
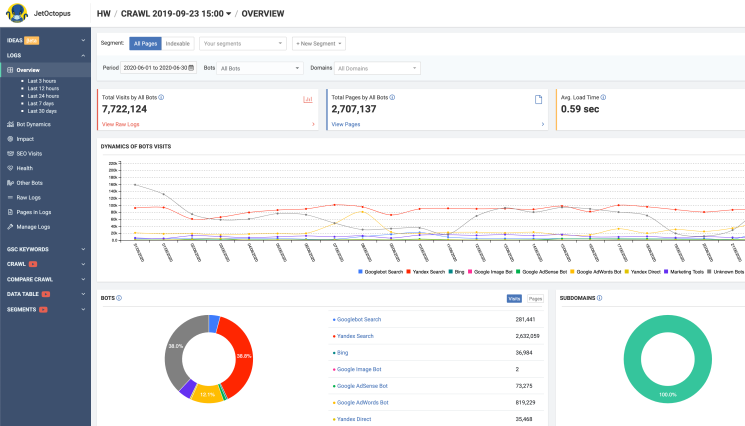
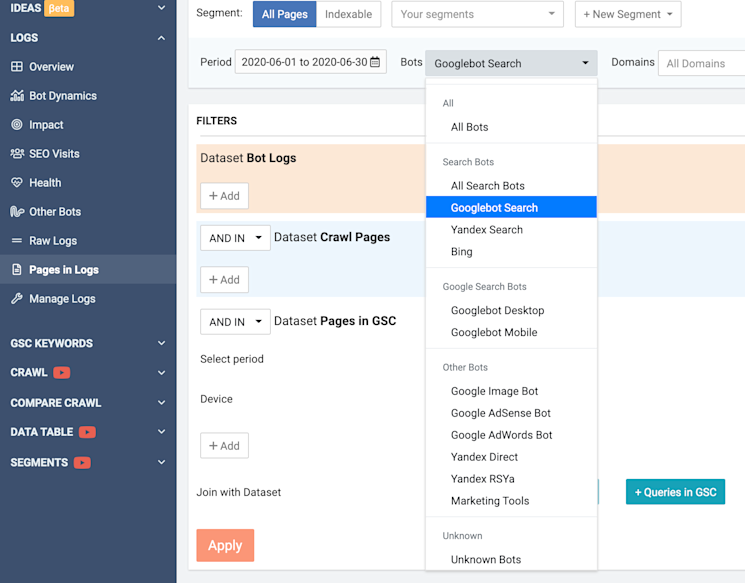
JetOctopus is a new kid in the block and I was impressed with its capabilities after testing it out for several sites. The tool delivers most of the standard features. The software uses some clever techniques to detect fake bots and it has a powerful segmentation feature.
2. Ryte Botlogs
I had the pleasure of testing Ryte Botlogs. The software is well made and works well. The tool has lots of standard features. Page groups is a unique feature I noticed, and it’s quite clever. Page groups give you an in-depth look at the bot activity on a particular area of your website. It also indicates which area of your website Google prioritizes.
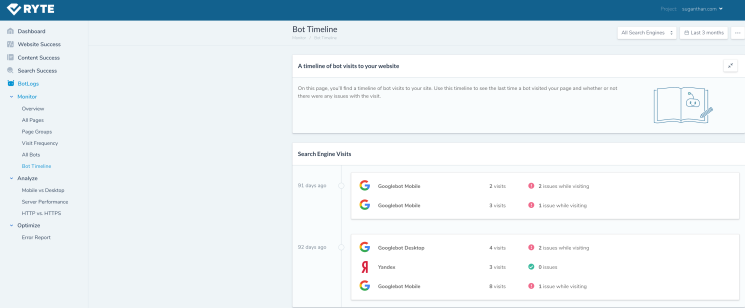
The more visits the site receives, the higher Google prioritizes that page group. You can also create your own groups. For example, if you want to focus on your blog section, you can do this by creating a group and adding your blog directory.
3. Oncrawl Log Analyzer
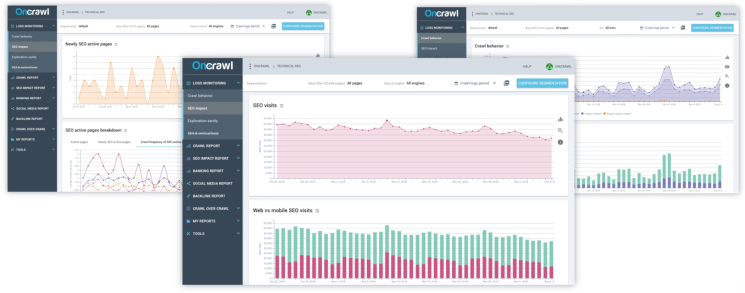
Oncrawl is another popular tool. It packs all the standard features. The analyzer has some unique features, including log format flexibility, where it automatically processes Apache, IIS, and Nginx log files. The company also makes it clear that the tool is GDPR compliant.
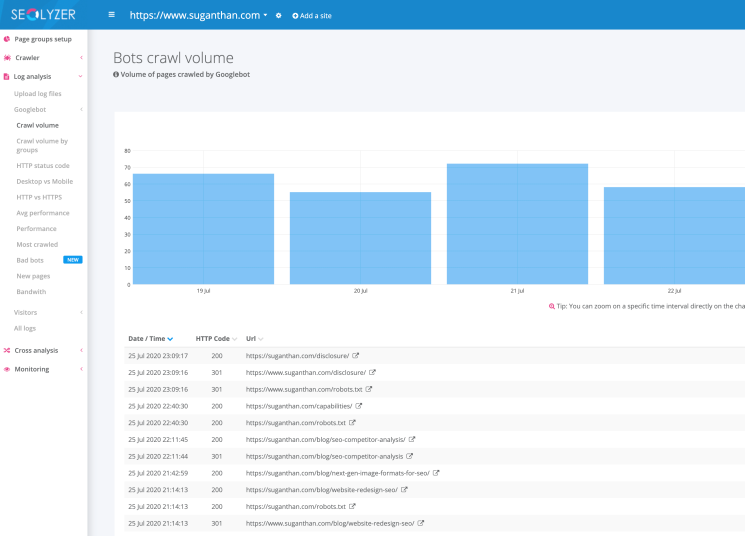
4. Seolyzer
Seolyzer is another fantastic log analyzer tool. When I moved my site to Netlify, I struggled to find a solution and Seolyzer offered an overnight solution by creating a Cloudflare service worker and I was instantly able to get logs. The company has great support and the free version can support up to 10,000 URLs. The tool is packed with all standard features including page grouping.
5. Screaming Frog Log Analyzer
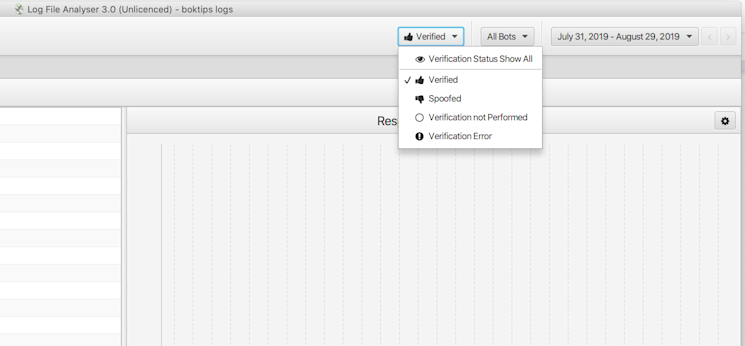
Screaming Frog is well known in the industry and is a standalone tool. There is no web or cloud support, so it means you need to download and upload your log files to the software. The tool itself is powerful and can process large log files. It has all the standard features and one of my favourites is the ability to verify bots.
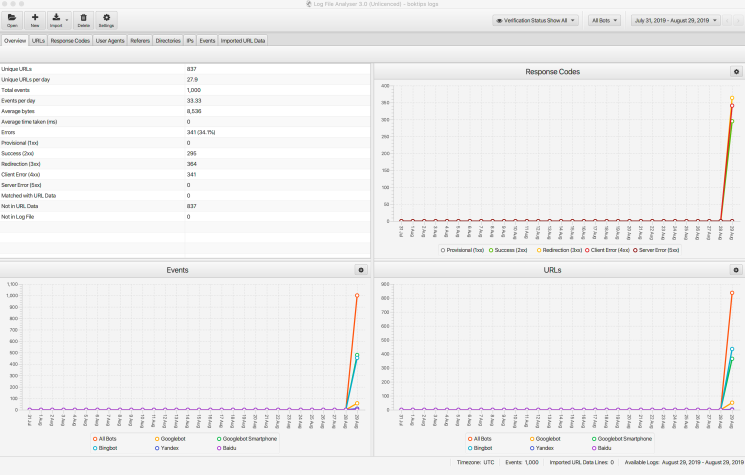
There are many other log analyzers out there, so I have only mentioned some of my favourites in this article.
So, what was the challenge I faced?
Recently, I moved my website to JAMStack. I ended up picking Netlify for hosting my site because it works well for JAMStack sites. But, there was a downside. Netlify doesn’t support logs. The company won’t provide logs, and when I asked about the possibility in the future, the representative said that even if the company offers them, it will be billable. So, I had to find a way around it.
I did some research and came across this wonderful tool called Logflare. I want to give a big thanks to Jr Oakes, Dawn Anderson and Charly Wargnier for introducing me to the wonderful world of Logflare.
Prerequisites
- Your website must use Cloudflare for DNS management.
- A Logflare account (Any tier would do, depending on the size of your website.)
- A free Google Data Studio account.
- My Template (Free)
- A BigQuery account. (Optional to configure longer than 60 days of log storage or to keep data in your own GCP account or customize the datacenter where your data is stored.)
So, how much does it cost me to do this?
The overall project cost depends on the usage and size of your website. Even then, it’s a hell of a lot cheaper compared to how much of the enterprise-level tools are charging at the moment. The beauty of this method is that you can customize and tweak it as you need and scale. As long as your data source is supported by Google Data studio, and you have a common join key — you’re in business.
So, let’s talk about the basic costs.
You can use Cloudflare’s free version to manage your DNS. However, I strongly recommend you get the professional version, as I find it a lot faster and it offers better support. The company will even throw in an account manager for you; the pro version costs $20 a month.
As for the Logflare, the pricing is about to be changed according to the owner. The free version is better for smaller websites, and for larger websites, you will be paying $20/mo maximum. Conditions apply, but it’s still a lot cheaper than most log tools. Also, if you use your own BigQuery account, the storage will be unlimited. I will show you how to do this further down.
So, for me, the cost came purely for the Cloudflare pro account, and keep in mind you can still use the free version of both, and do the whole thing for free.
Step 1 – Switching my DNS to Cloudflare.
To use my template, you need to ensure your DNS is managed by Cloudflare. First, you need to create an account. Then, follow the instructions carefully to change the DNS of your domain. Important: Please keep in mind changing your name servers can take your website offline for up to 48 hours in some cases. Make sure you’re fully aware of this before you attempt this process. I’m not responsible for any downtime or loss of revenue.
Step 2 – Setting up Logflare
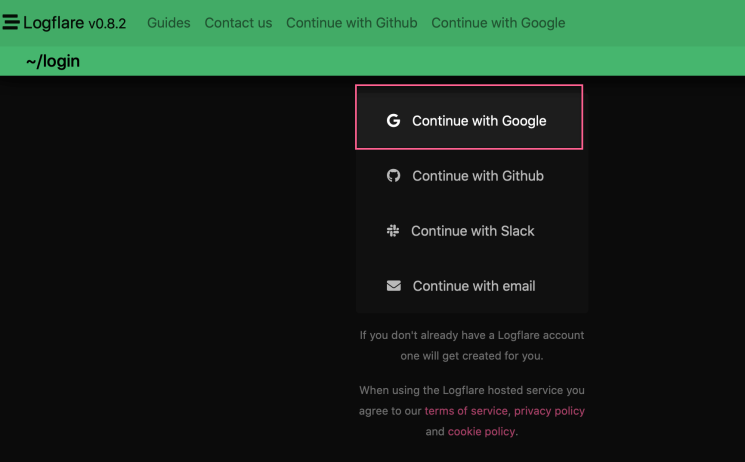
Logflare set up is extremely easy. First, head to the website and create an account. I highly recommend you use your Google account.
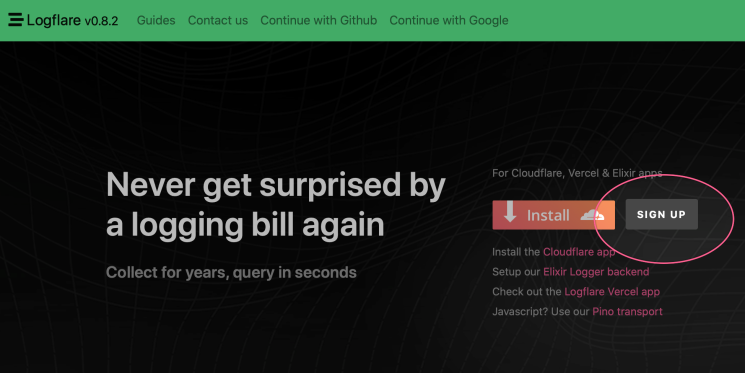
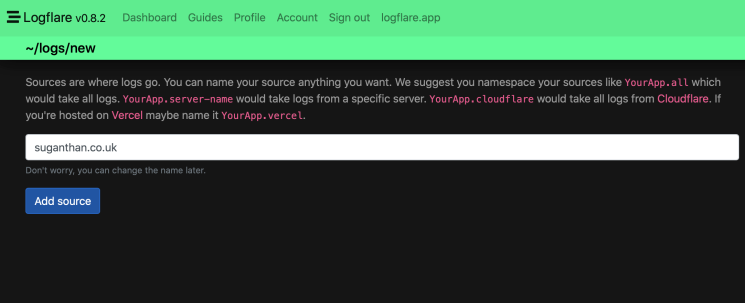
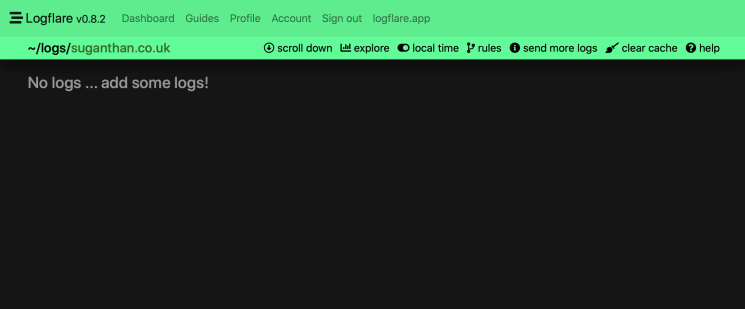
You are now ready to receive logs.
Step 3 – Receiving logs
The next step is to start receiving logs to Logflare. Logflare makes it easier by providing an app for Cloudflare, so you don’t have to deal with setting up a service worker.
Log in to your Cloudflare account and locate the apps section.
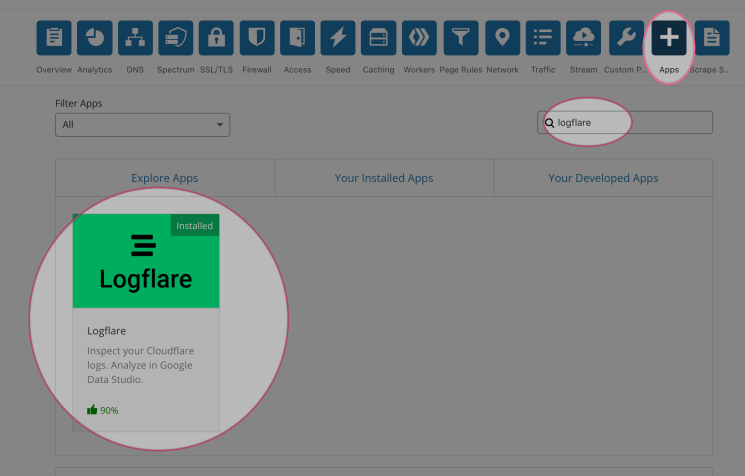
Search for Logflare and click preview app. Now, click install and follow the instructions to install the app. Once it is installed, you have to log in to the account.
If you head back to Logflare, click Dashboard and check the source. You will see the logs starting to come in.
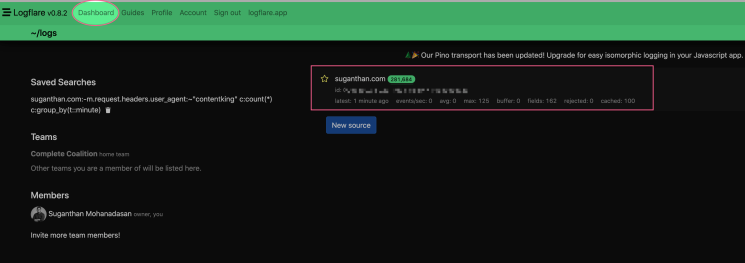
Click the source for a detailed look into your logs. You can query specific logs using the search window at the bottom of the page.
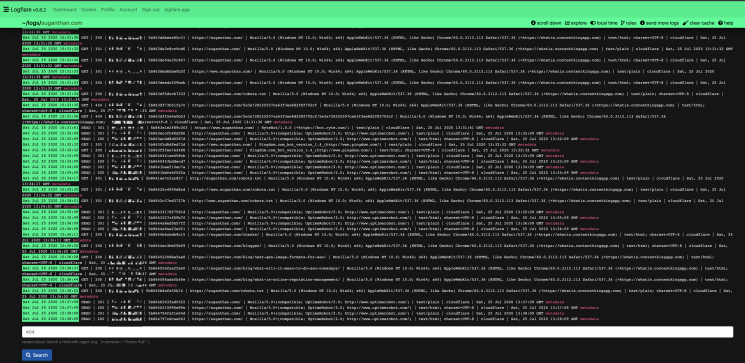
For example, I use the ContentKingapp to monitor my website changes in real-time. As it’s real-time, ContentKing is constantly checking my sites and if I want to filter it out from my view, I can use something like this in the search box.
-m.request.headers.user_agent:~"Contentking" c:count(*) c:group_by(t::minute)
It will filter out all the user agents from ContentKing from the results. You can do a lot of the filtering here and save them for another time.
Now we’ve got everything up and running, you can see how easy it is to use Logflare.
If you use the free subscription, the company will hold your log data for seven days. But, we want to keep them forever and have 100% ownership right?
Roll in the BigQuery!
The next step is to push these logs to your BigQuery account.
Step 4 – Sending logs to BigQuery
First of all, you need a BigQuery account. If you don’t have an account you need to set up one.
Go here to sign up.
It’s important to remember that BigQuery is a paid service. The brand has a free tier and it should give you a decent amount of space to work with. Overall, it’s cheap and affordable. You can easily store millions of logs for next to nothing in terms of cost. The best part is that you own the data forever.
You can overcome most of the PII and compliance issues highlighted above since you will be owning the data and processing it.
For companies with strict compliance and legal issues, you could just set up your own Cloudflare worker and send only the data you specifically want.
So, if you didn’t want to send Logflare the IP addresses of your site visitors, you don’t have to. Or if you wanted to filter on User Agent at the Cloudflare level, you could only send Logflare Googlebot user agent requests and nothing else.
Let’s imagine you get a PII delete request. You could conduct an SQL query and can delete it all since Logflare stores all the data in BigQuery. It would be trivial to delete all records associated with a single IP address.
Ok, now let’s get to work.
Follow these simple steps to configure the BigQuery connection.
Step 5 – Pull Logs from BigQuery
If you use a Google account, when you log into Logflare with your Google account, you will get access to the underlying Big Query tables associated with all your sources.
After you set up the connection, the log data will be sent to BigQuery and stored there.
Step 6 – Adding the source to Google Data Studio
Follow this link and add your Logflare data source to Data Studio. But, please skip to the “how to use the template” section at the bottom of this article to continue. When you add the log source, you need to create a few calculated metrics. It’s an important step.
Step 7 – Setting up a nice template
Logflare provides a basic data studio template. But, I wanted something a bit more detailed and complex. Especially something where I can bring in other data sources and start blending data. I realized it could be useful to others so I decided to release it for free.
So, what’s in the template?
This template contains 12 slides as follows.
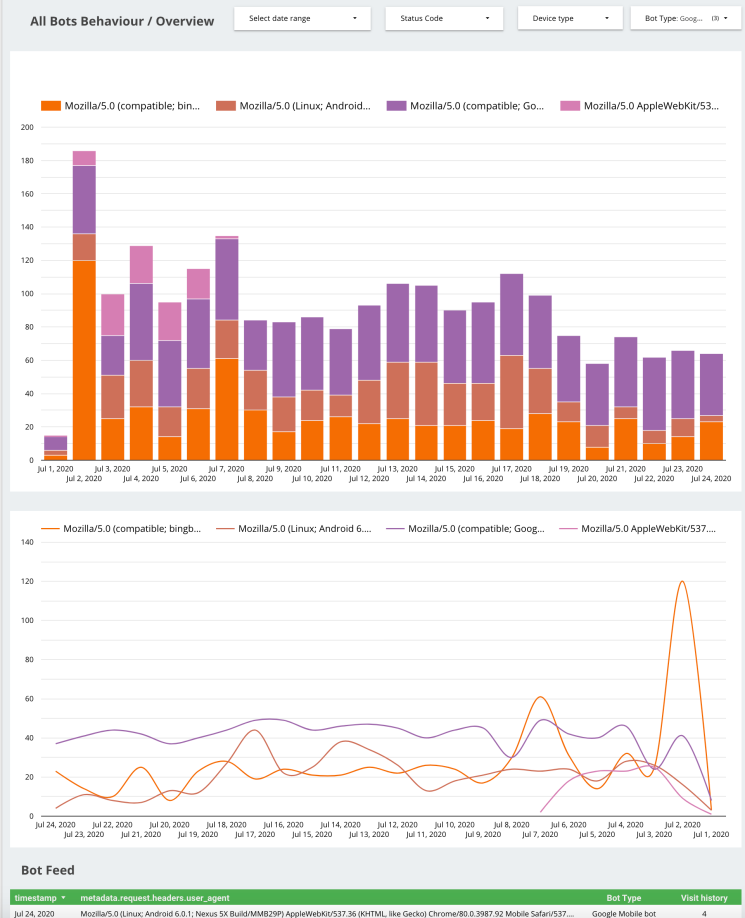
All Bots Behavior / Overview
This slide shows all bot behaviour across your site. This is an overview of the full picture. You can use the table or graph view to see the visualization. There is also a bot feed that shows you a full visit history, alongside the type of bot accessing your site. This will be a fully up-to-date feed as long as the data sources are up-to-date.
Crawl volume & visit frequency
This slide shows the bot crawl volume and visit frequency. You can see the number of URLs crawled by day and visit frequency over time alongside the associated response codes.
Knowing your crawl volume and frequency is important so that you can understand which areas that search engine bots pay attention to. More importantly, you can also view crawled URLs with error codes or redirects.
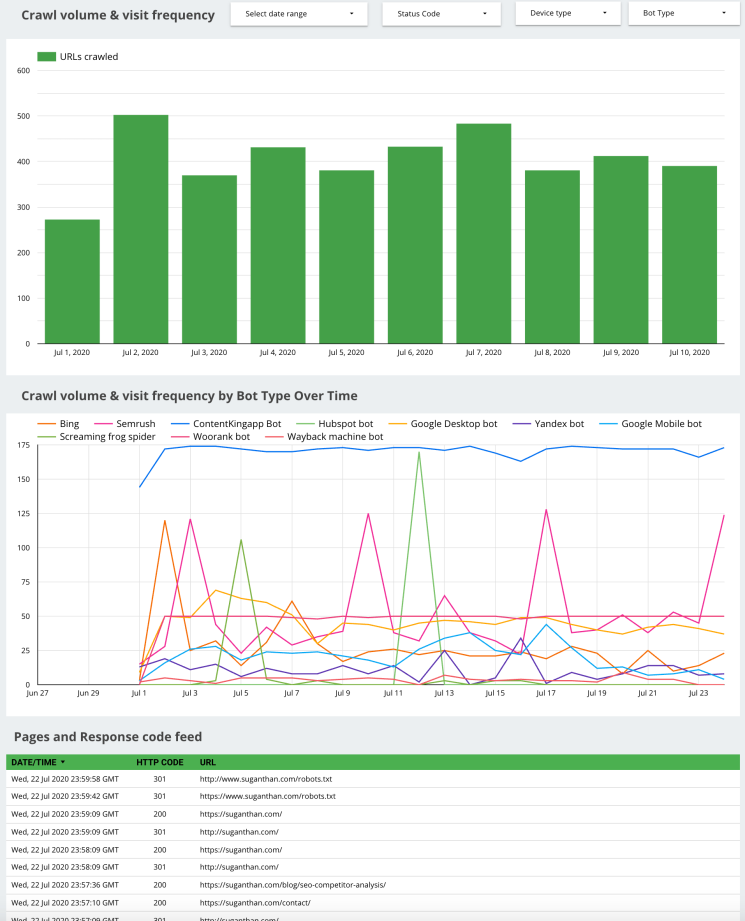
You can use this data to get a feel for how your preferred search bot is crawling your pages over time. You can use it to spot irregularities and potential issues on your site and make the changes accordingly.
HTTP Status codes
HTTP response status codes indicate whether a specific HTTP request has been successfully completed. Remember that pages with errors waste crawl budget and can also be dropped from organic search rankings.
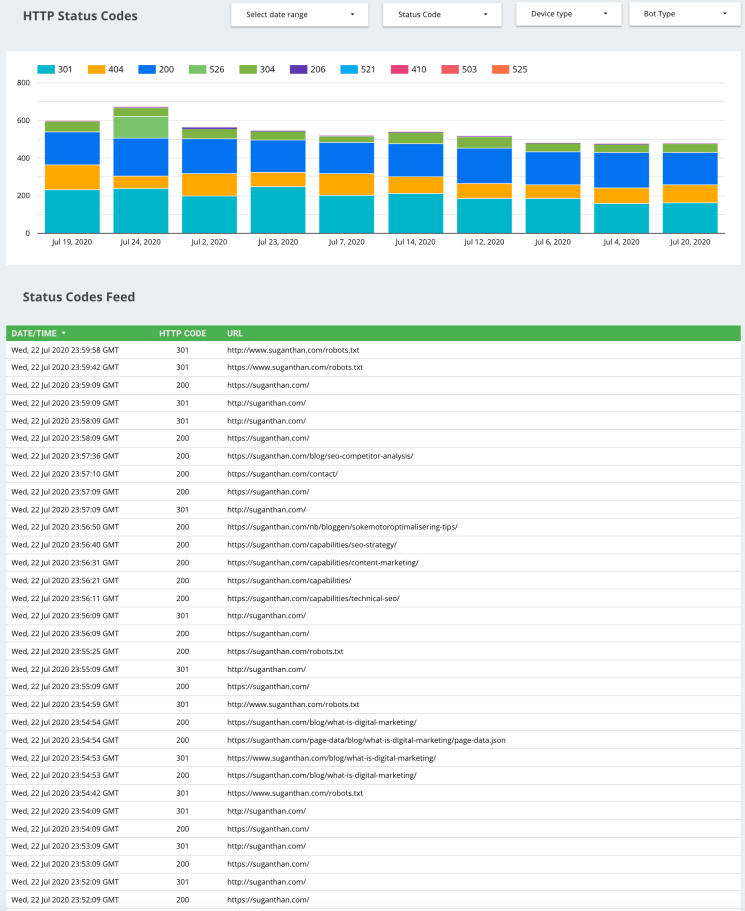
You can see how your website pages are responding to HTTP requests and what code they are sending. For example, a status code 404 indicates that the requested page is not found.
You may want to further investigate and figure out if an important page is accidentally deleted. A 301 status code indicates that the page has been permanently redirected. Unlike a web crawler tool, logs provide an accurate picture of the status codes.
Desktop VS Mobile Bots
Search engines like Google often use different bots to crawl desktop and mobile versions of your website. You can separate this data and dig deeper into the type of bots used by the search engines.
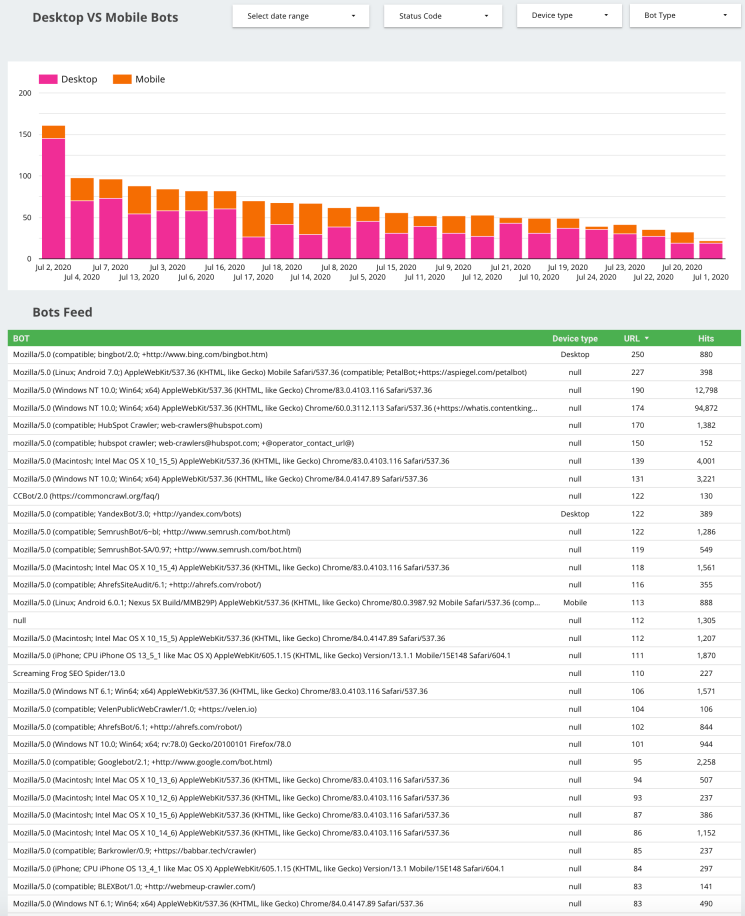
We know that Google has changed all websites to mobile-first indexing. It means Google will consider your mobile version over desktop and its given priority. As a consequence, you will find that your site is crawled more frequently by mobile crawlers.
Google Analytics, GSC, Log Data & Conversion impact
This slide has data blended from three different sources. We have Google Analytics, Google Search Console and log data. You can see page URLs, Impressions, Queries on-page, Clicks, and Google Analytics user session data.
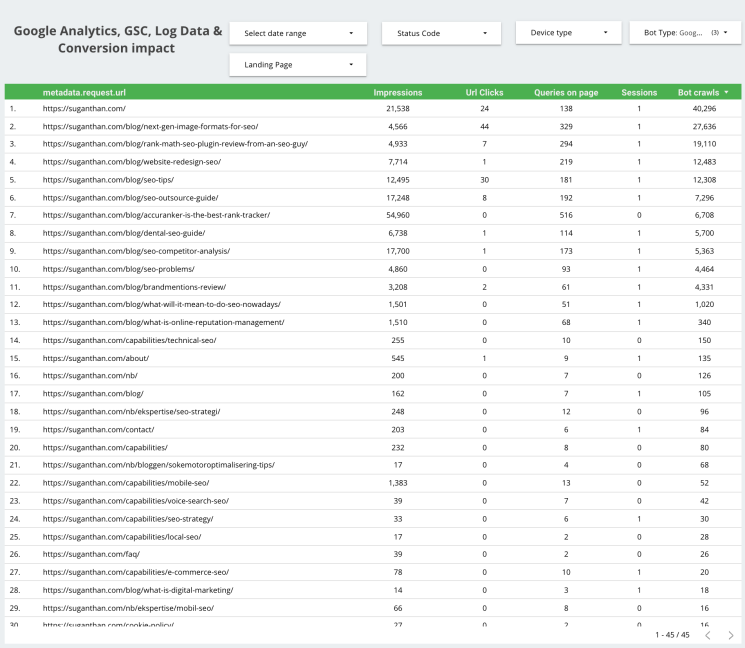
The idea behind this slide is to give you a combination of data in one place. In other words, the data is overlaid on top of each other and it will give you more context. For example, you can see the number of organic impressions and clicks a specific page is getting, and at the same time, the number of Google Analytics sessions, and the number of times that specific page is crawled by selected bots. You can easily add a conversion goal and even map that into this table.
Bots Crawl Behavior by Page
Understanding the behaviour of bots on selected URLs is critical so that you know when different types of crawlers access specific URLs on your site. Ideally, crawlers should pay more attention to the core areas of your site, rather than supporting or seldom-used pages.
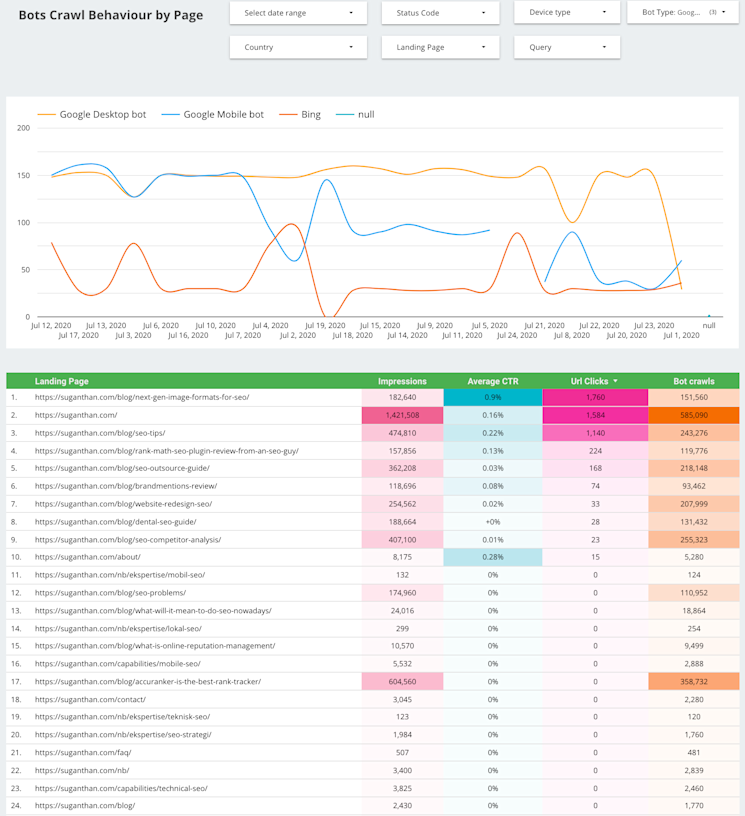
As we see from the above, webmasters can study which areas of their site receive the most traffic and whether this correlates with the amount of crawling taking place.
As we can see, my homepage receives the most impressions and crawls, which is ideal. If you see pages with an abnormal amount of crawls, this will waste your budget and you will need to take action.
Most Crawled Pages
This slide shows webmasters a plethora of information for most crawled pages, including bot type, user agent, and hits. Above the data, we can also see the information summarized into four neat compartments.
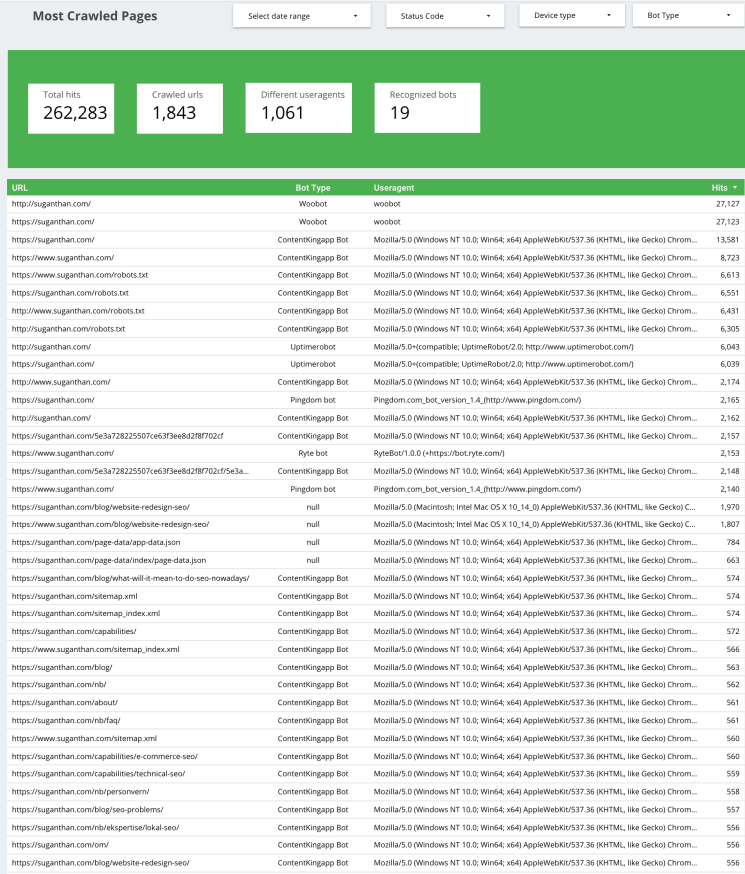
Use this data to get a greater insight into which your pages are crawled most. By also understanding which bots are making multiple crawls, we can differentiate between search crawlers and other bots, such as ContentKing. We can use this to understand why certain pages are crawled less and investigate them further.
Pages not crawled by Bots
Here we can see which pages are not crawled by bots. Sometimes it is important to restrict bots from unimportant pages, but occasionally, a rule might be triggered by accident.

By viewing which pages are not being crawled by bots, we can see whether any pages are not being crawled by accident. If you see a page that should be crawled on this page, you should be able to take the appropriate action.
So, it seems several of my site pages are not crawled.

Keyword impact vs crawl
This sheet enables us to understand several factors related to how people are discovering our sites. It offers the URL, relevant query, country, impressions, average CTR, URL clicks, and bots crawls.
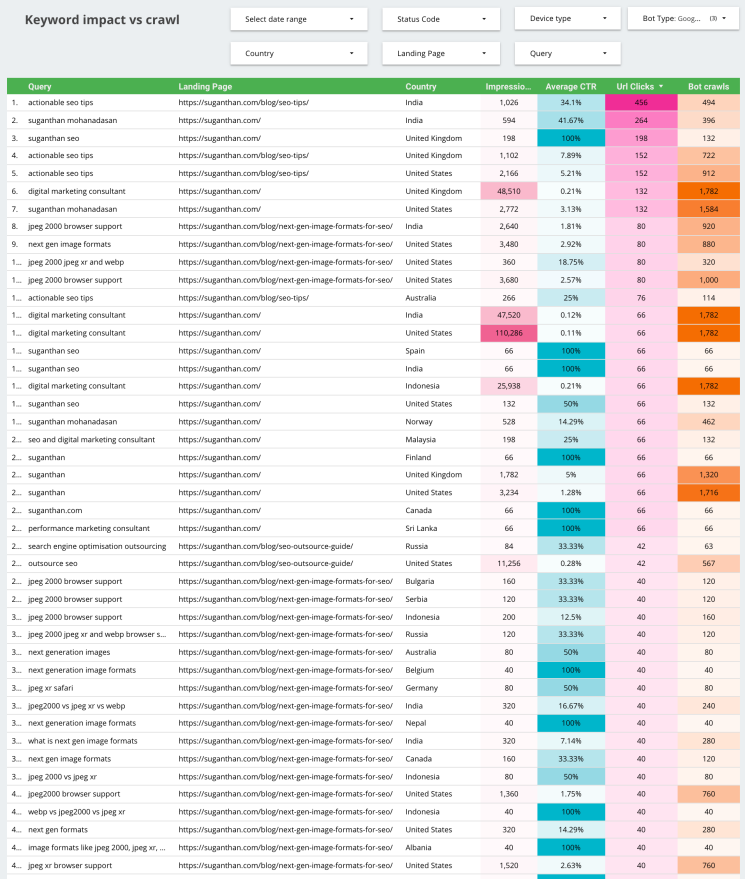
By comparing and analyzing the information, webmasters can evaluate their most important queries and judge whether the pages with their most important keywords are receiving the appropriate attention from search engine crawlers.
There are many actions you can take to encourage crawlers to visit your more important pages, including restructuring your internal linking and adding fresh content.
Error Report
On this slide, we can view reported errors across the timeline. It provides us with the URLs in question, what error is being reported, and the number of times the pages are crawled by selected bots.
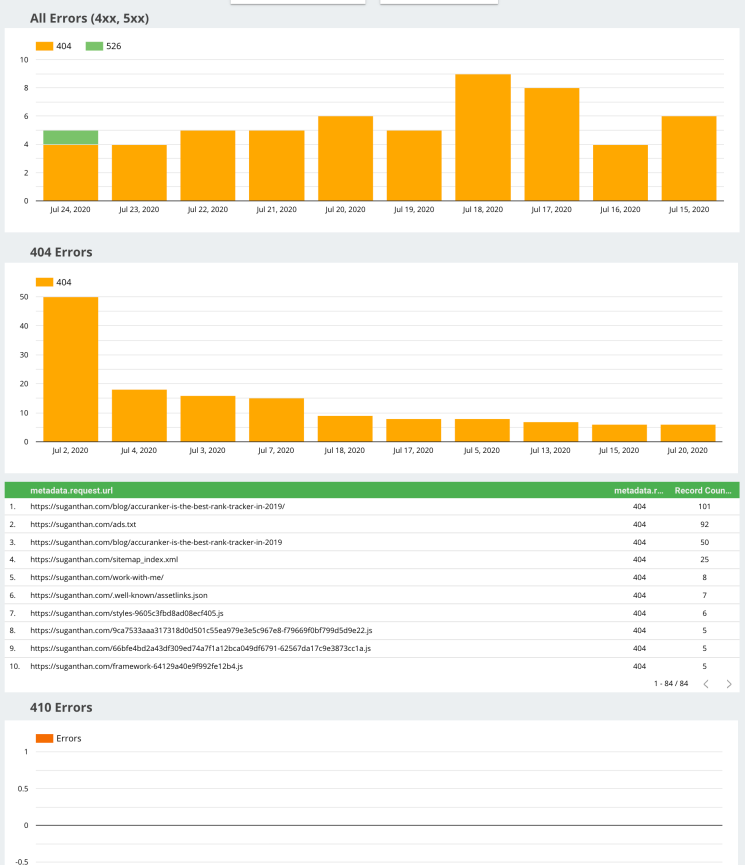
By using this data we can view and judge whether the fixes that we are applying to our sites are being recorded by crawlers. It also helps us understand which status codes take up the bulk of our issues. This is important to know, as some status codes can be more detrimental than others.
Average Response Time
Page load speed is everything. Here we can view the average load times experienced by bots over many days.
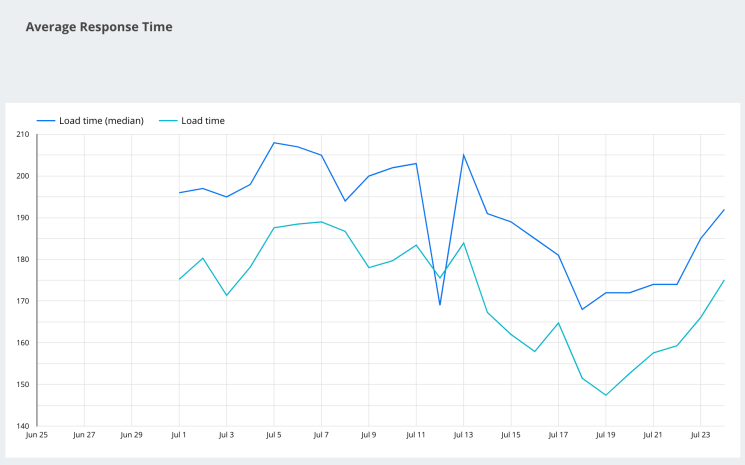
If you find that your average response times across your site are increasing, it is important to understand why and take the appropriate action. Page load times matter to both users and search engines, and slower load time can dramatically affect the organic performance of your website.
Cloudflare Cache Status
This page shows Cloudflare’s caching status across your website, and includes the values returned by cf-cache-status.
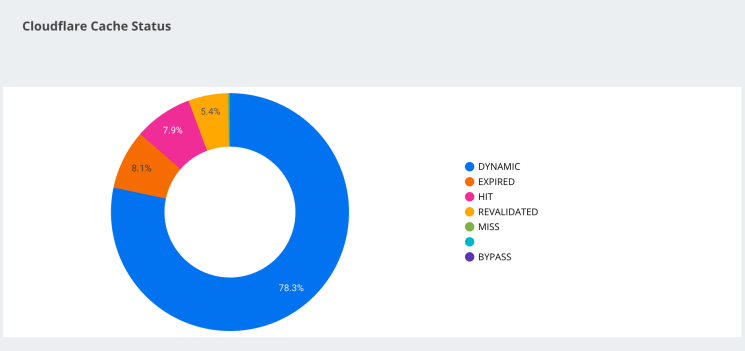
Use this sheet to understand what Cloudflare encounters across your site and whether it is caching pages appropriately. A HIT, for example, means that Cloudflare has cached your page. A MISS means that Cloudflare looked for the URL but could not find it. You can influence how Cloudflare caches your website using Page Rules or Cloudflare Workers.
How to use the template.
For this template, I’m using the following data sources. (You can add more sources here if you want to further extend the capabilities of this template)
- Logflare log data from BigQuery.
- Google Analytics.
- Google Search Console (Page and Domain level sources)
- Website sitemap data using Google Sheets.
First of all, you need to create the data sources so it’s easier to replicate my template.
Go to https://datastudio.google.com/ and click data sources and new source.
Select BigQuery:
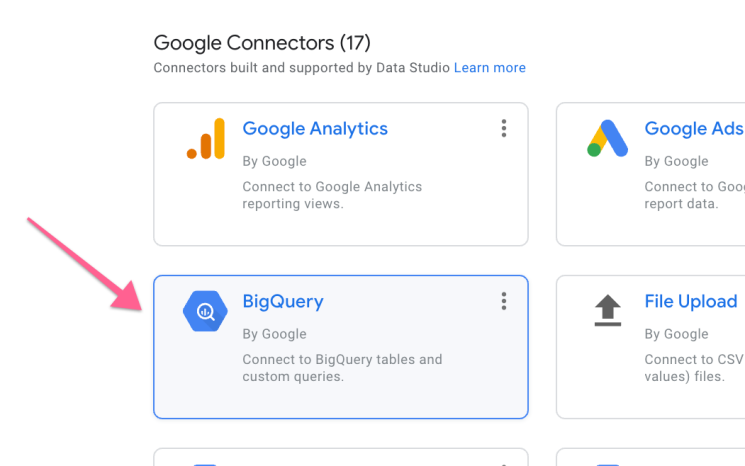
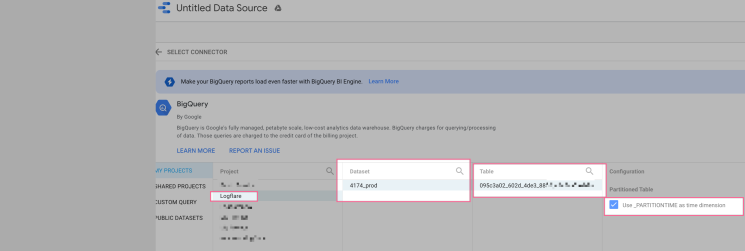
If you have already done the BigQuery integration, as explained above, you should see your Logflare data here. Follow these steps in the screenshot below and click connect.
The connect button is in the upper right-hand corner.
You will see the following:
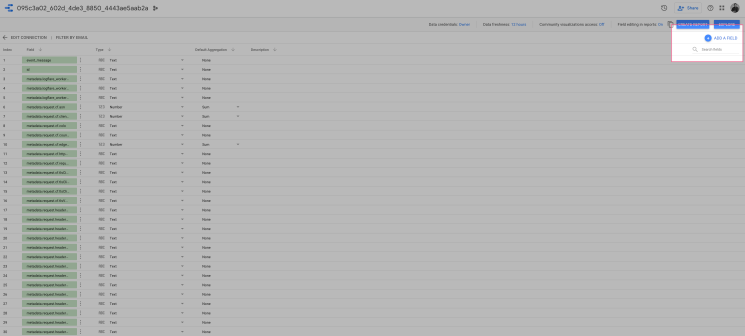
We need to do some tweaks, here. I’m using a calculated field here to segment the Bot type and Device type.
Click ‘Add a field”, Name it “Bot Type”.
Paste the following code. Here is a link to the GitHub repository.
I have already done the heavy lifting for you. This template will currently identify 17 different types of bots. You can add additional bots easily, here.
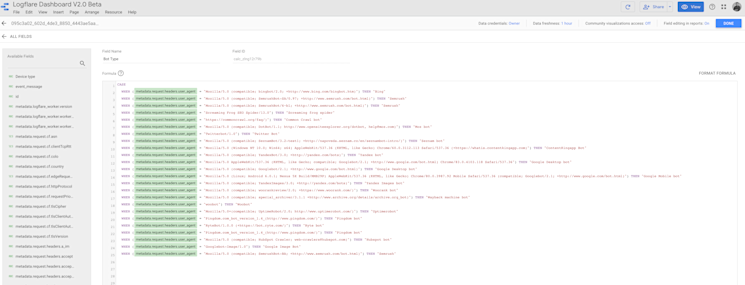
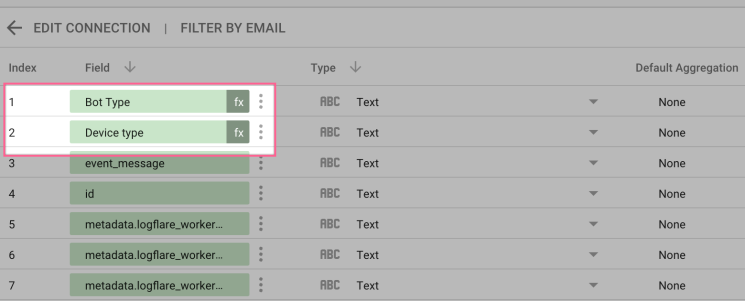
Save and repeat the same process for “Device type” Now you should have two custom fields in the section. Ensure it’s done correctly and that there are no errors at this point before you add the source.
If you look at the code, you will see this is just simply matching the user agent and giving it a nicer and easy name.
WHEN (metadata.request.headers.user_agent = "Mozilla/5.0 AppleWebKit/537.36 (KHTML, like Gecko; compatible; Googlebot/2.1; +http://www.google.com/bot.html) Chrome/83.0.4103.118 Safari/537.36").
THEN "Google Desktop bot".
When you start using this on your website, you will start seeing all sorts of bots and I highly recommend you add them to the list, so it’s easier for you to identify them in the template.
Pro tip: Logflare doesn’t identify bots. The user agent does that. All hits are included. If a request is made to your site you should see it in Logflare. Because it’s easy to spoof a Googlebot hit, we need to validate the bot. A common practice is to use Reverse DNS to look to verify the bot. Just to make sure it’s coming from Google.
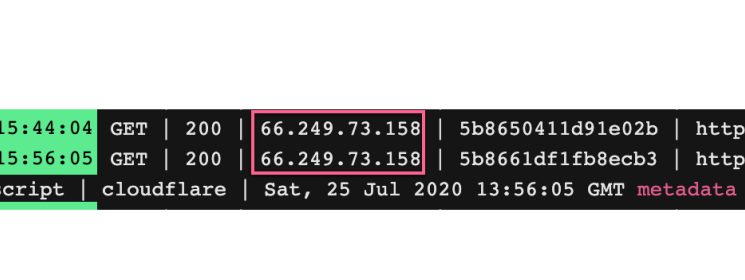
As you can see these hits came from Googlebot. If we pick this IP and do a reverse lookup, you can see it belongs to Google.
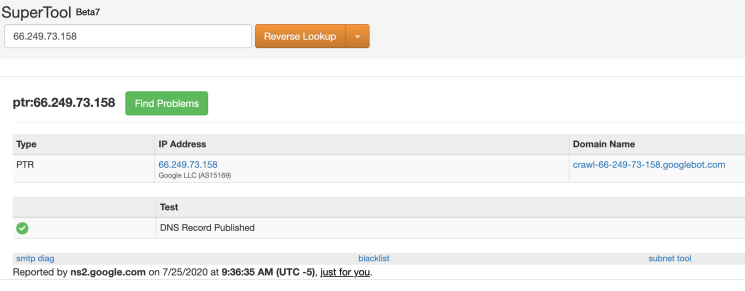
After speaking to Serge Bezborodov (CTO at JetOctopus) it became clear that there is a much easier way to identify Google bots. From his experience of dealing with terabytes of log data, he concludes that the majority of the Google search bots uses the IP address which starts with 66.xx
You can do this inside BigQuery or Google Data Studio.
You can do this in Data Studio with a regex match of the IP address field to make sure it starts with `66.`. Create a calculated field (say `googlebot_ip`) from this and if it starts with `66.` then that field value is `true`. Then you can create a filter where only googlebot_ip == true.
I will add this in the coming days to the template.
This step is not mandatory, but it will greatly increase the accuracy of your Googlebot verification and accuracy.
Pro tip:There is another way to do this. If you have an Enterprise account with Cloudflare, the company will give customers a bit score in the cf object you can see in a request. Then you can see that data in Logflare. It’ll be a number from 1 to 100. 100 being a bot.
Now we are all set with the BigQuery source.
Let’s move on to adding Google Analytics, Google Search Console, and Google sheets.
These are fairly straightforward.
However, there is a tiny bit of a problem with Google Analytics. Let me explain. Whenever you want to blend data (I assume you know the data blending basics), you need to have join keys.
These are primary keys and you need a common attribute between the sources to match the data and join them. In our case, we are using URLs from the log data as a join key with the URLs from the log data.
But, Google Analytics will not show you the full URL path by default.
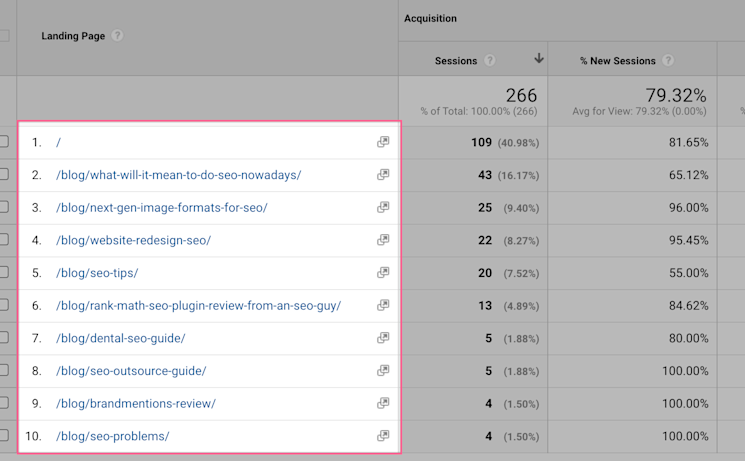
You need to force it with a filter. So, unfortunately, this is a step you need to do. Not to worry, I have the filter settings for you, here. I highly recommend you create a new view inside Analytics when applying the filter. But, it also means you won’t see past data. So, this is a caveat.
After you apply the filter, you will get the full URL path in Google Analytics.
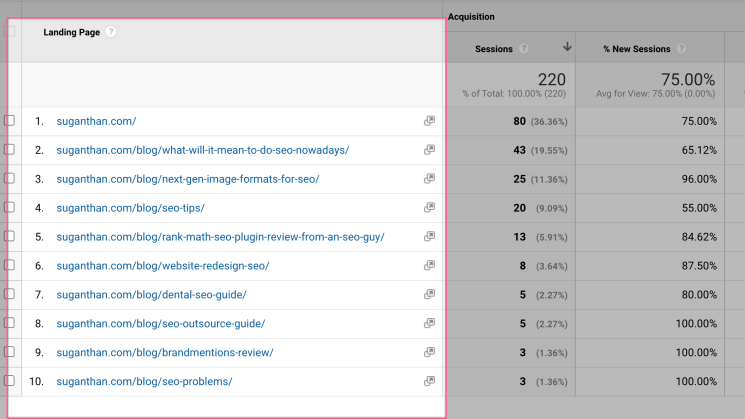
But this causes a different problem. Google Analytics will not show the HTTP or HTTPS in the URL. We can’t use the URL without the protocol as it will not match this as a join key for us to blend the sources.
To solve this problem I decided to use the CONCAT function so add the https protocol to the URLs.
I will explain how to do this in the tutorial section below.
Here are the instructions for creating the Google Analytics filter.
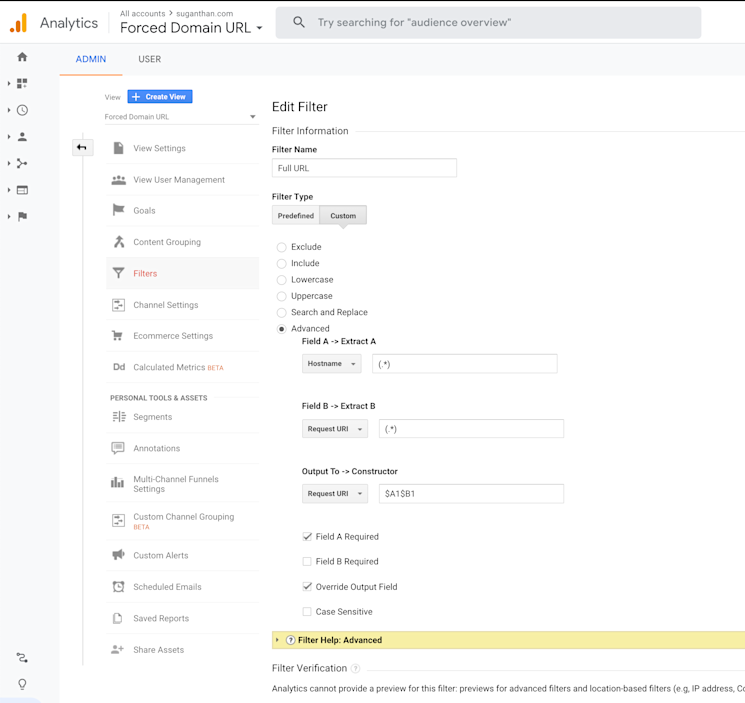
Now we solved that problem, let’s go ahead and add Google Analytics as a source.
Go to https://datastudio.google.com/ and click data sources and new source.
Select Google Analytics.

Make sure you select the correct view, which is the view with the full URL path filter in my case.
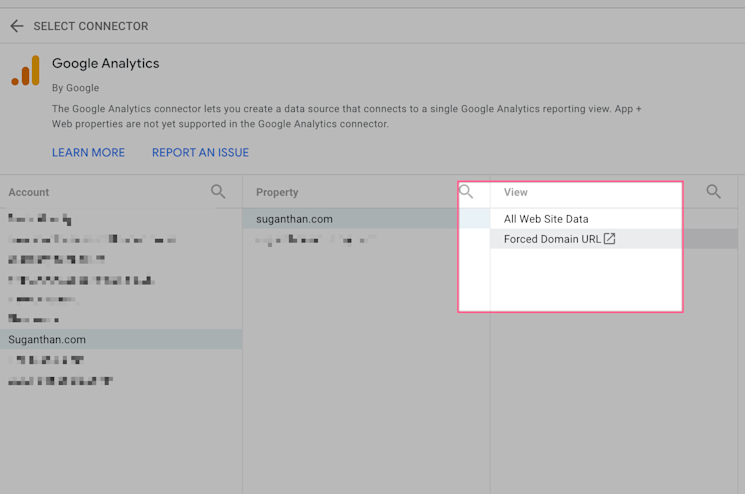
Now you will see this screen. Before you add the connection lets create a new calculated field so we can hard code the HTTPs URLs.

Click “Add a field”
Name it “Landing page with protocol” and use the following code.
CONCAT(‘https://’,Landing Page )

Add the formula and save.
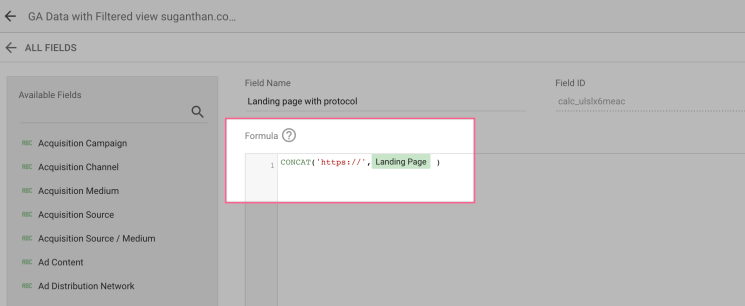
After doing this click Connect. That’s it.
Moving on, Let’s connect Google Search Console data.
Follow the same steps as above for Google Search Console and add it as a source as well.
Click connect and your source will be added. Moving on, Let’s connect Google Search Console data.
Follow the same steps as above for Google Search Console and add it as a source as well.
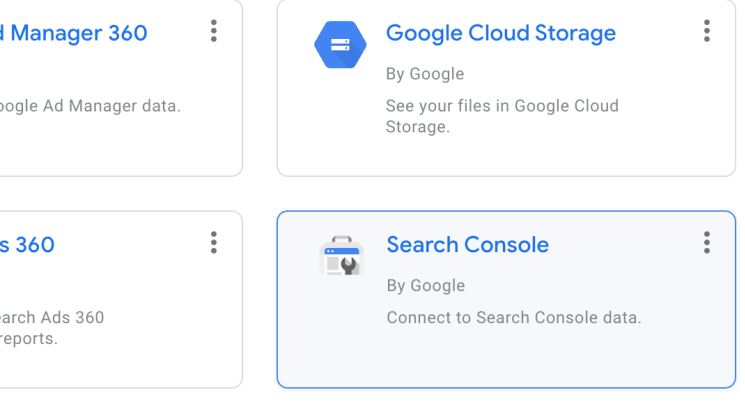
It’s important to note that you need to add both page-level and domain-level properties to the Data Studio as we need the data from both levels.
Make sure you add them both separately. So, in total, you will have two sources for the Search Console data.
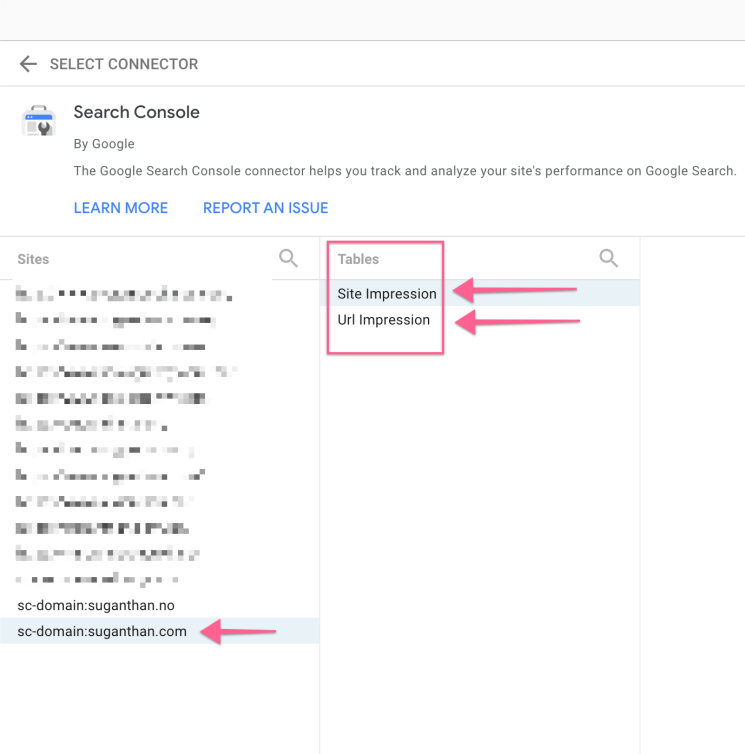
I have added four sources and we need to add the fifth source.
We want to see which pages are not crawled by bots. To do this, we need to somehow figure out a way to list all the sites URLs, and then look at the ones already crawled by the bots.
To do this, we use a simple method. We look at the sitemap.xml file and pull all the URLs into a Google sheet and then use that as a source into Data Studio. The assumption is that all the site’s important pages will be present in the sitemap.xml. But, please do double check this as it may be different in your client site.
First, go to Google Sheets and create a new sheet. Find your website sitemap.xml (I’m sure you know how to do this as an SEO). Now, add the following formula and it will pull the URLs.
=IMPORTXML("https://www.suganthan.com/sitemap.xml", "//*[local-name() ='url']/*[local-name() ='loc']")
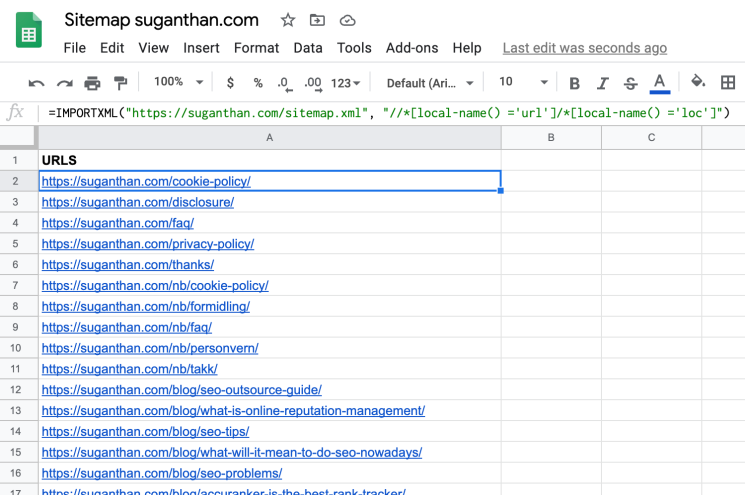
Verify that the sheet has all of your website’s important pages.
Now, let’s head back to Data Studio and add this as a source.
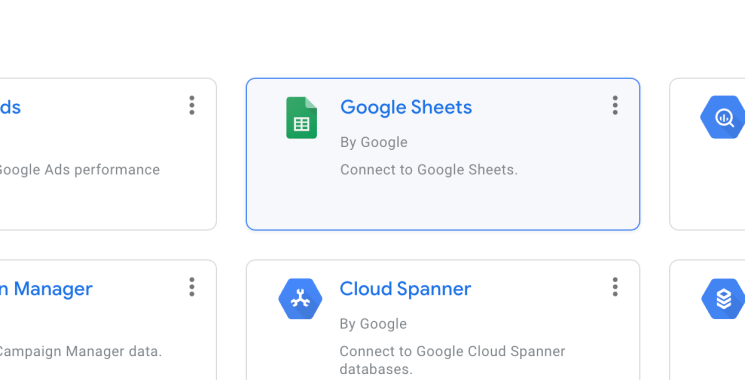
Select your spreadsheet and click connect.
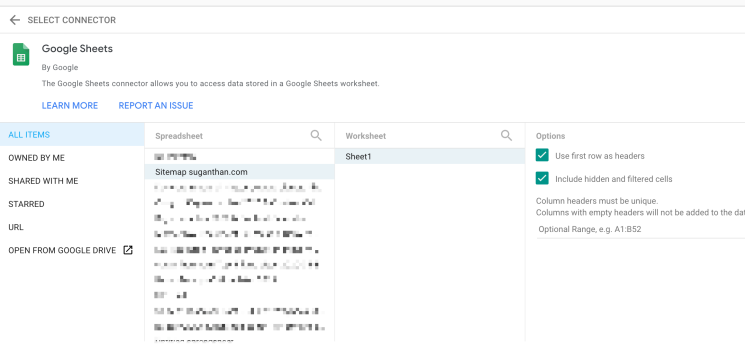
Now, we have successfully added all five of your sources. Let’s go ahead and use my template. You can find the template, here.
Before you begin, please make sure you make a copy of the template — this is very important.
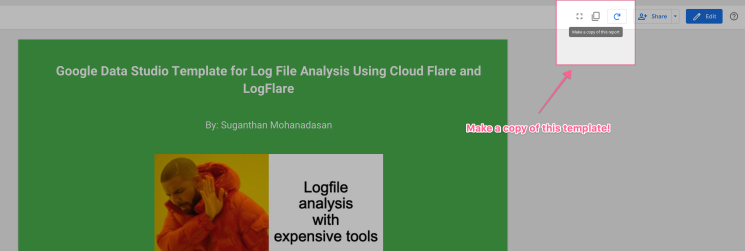
Now the data studio will ask you to select the sources. Since we already created these, it’s just a matter of mapping it out and matching it with your own sources. I have provided my website’s sources for demo purposes (you won’t be able to edit them), but using this guide you can select your own sources. Please do not abuse the data in any form/shape. Don’t be that person.
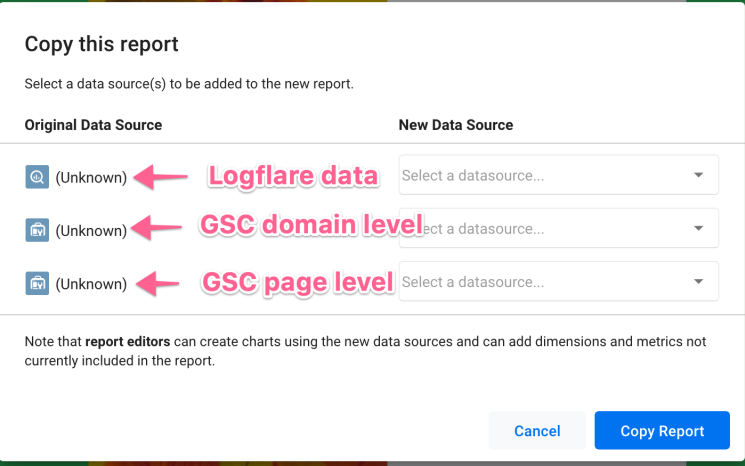
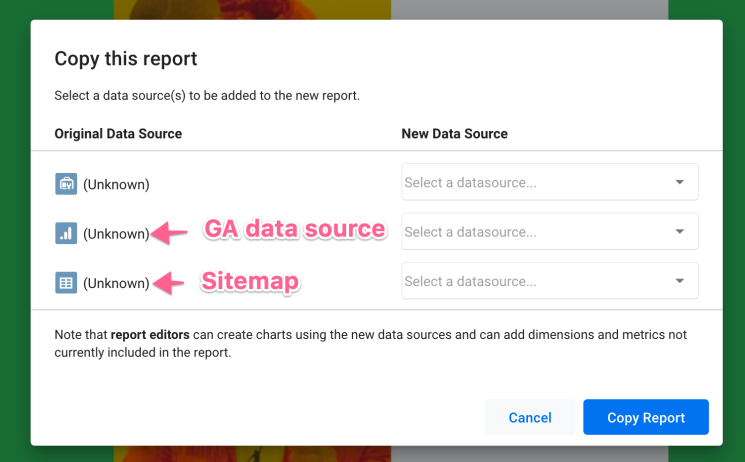
Now, click the new data source drop-down button and select your sources.
Once you have done this, click Copy report.
That’s it! Now you have successfully configured the template.
Now pay close attention to the next point. It’s extremely important.
Make sure you’re selecting the right bot type in the drop-down button when doing analysis. The data you see is raw, and if you don’t set the right bot type, you will get inaccurate results. You can also set a default filter in Data Studio.
You can see I have set some of the common bots as default.
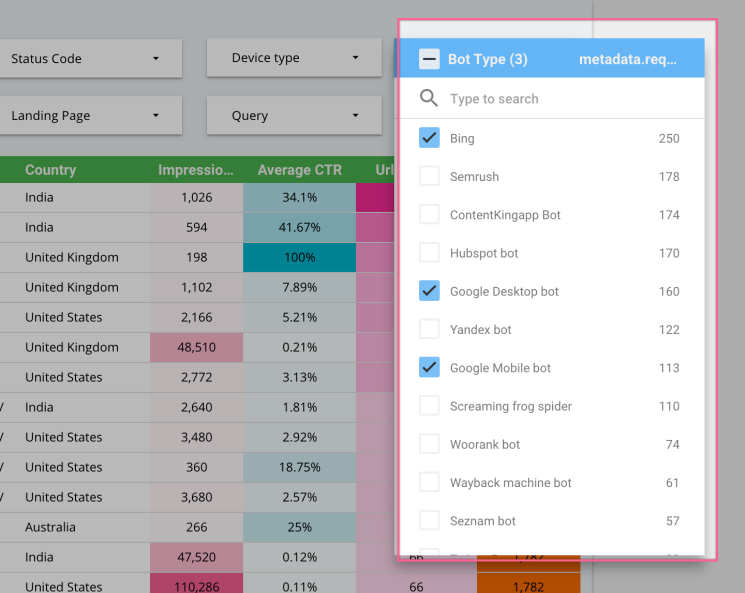
This template gives you the flexibility and freedom to tweak and do whatever you want with it. So, have fun with it.
I have also spent a significant amount of time building this template, so I’d appreciate it if you can share and leave some feedback. Thanks in advance!
P.S: I’m aware of small issues on the template (Such as order by date etc. I will be continuously working on this template. So please do check the version and update if necessary) Also, I will not provide one to one technical support as I have already spent a considerable amount of time building and fixing issues. But, happy to answer any questions whenever I’m free.)
Last, I want to give credits to several people who helped me. Aarne Salminen – Helped me a tonne with the template logic. This wouldn’t have been possible without him. A huge thanks to him. Andy Chadwick & Daniel Pati – Helped me with beta testing and feedback. Chase Granberry– He is the founder of Logflare and he helped me a lot in understanding the overall system and technical side of things.
Let’s talk & work together
Whether through my agency or as an independent consultant, I am here to help your business or project succeed.
Related articles
Stay updated!
Subscribe to get latest news, insights, technology, and updates.
" " indicates required fields


