I Tested 3 Ways to Forecast SEO Traffic. Here Is What Actually Works.
I ran the same 486 days of GSC data through Claude, ARIMA, and Meta Prophet. All 3 landed within 10% of each other, but what you get around the numbers is completely different. Free setup guide included.
v1.1 Update (April 2026): Now with event annotations and interactive Plotly charts. Mark algorithm updates, migrations, and launches directly in the forecast. Prophet uses them as statistical regressors to improve accuracy. New chart tool generates zoomable HTML visualisations with confidence bands and event markers. Full changelog below.
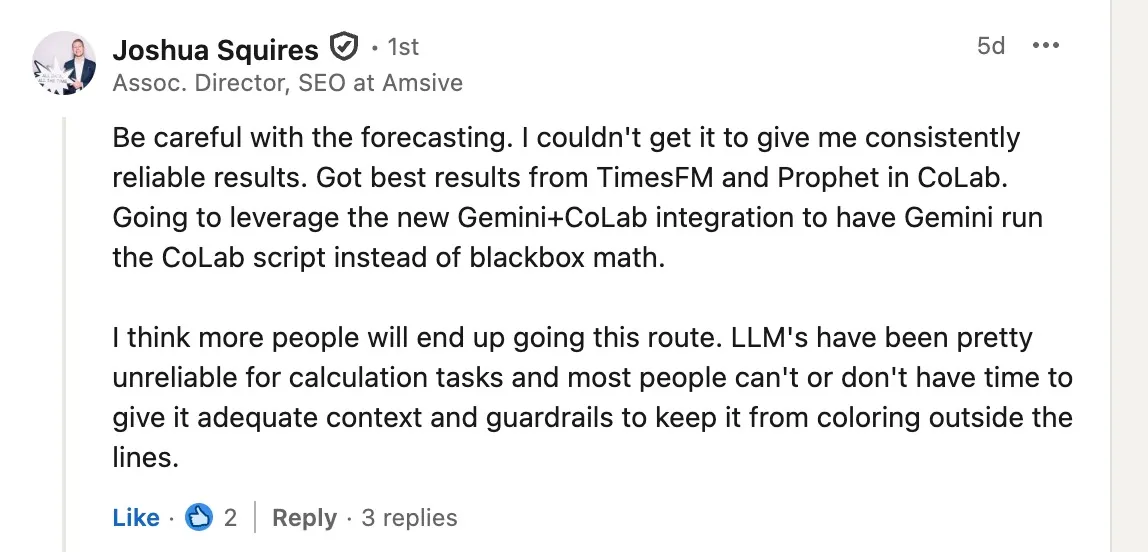
Someone on LinkedIn told me LLMs can’t forecast traffic accurately. Joshua Squires from Amsive left a comment on my BigQuery MCP post saying he got the best results from Prophet and TimesFM in Colab, not from asking an LLM to crunch numbers. Fair point. My BigQuery MCP server had a forecasting tool, and the numbers it produced were more of an educated guess than a statistical model.
So I built a Prophet MCP server that runs Meta’s Prophet locally through Claude Desktop. Then I got curious. If the common wisdom is “LLMs can’t forecast, use proper models,” what happens when you actually test that? Same dataset, 3 different approaches, 486 days of real GSC data from one of my sites.
The results were not what I expected.
The test
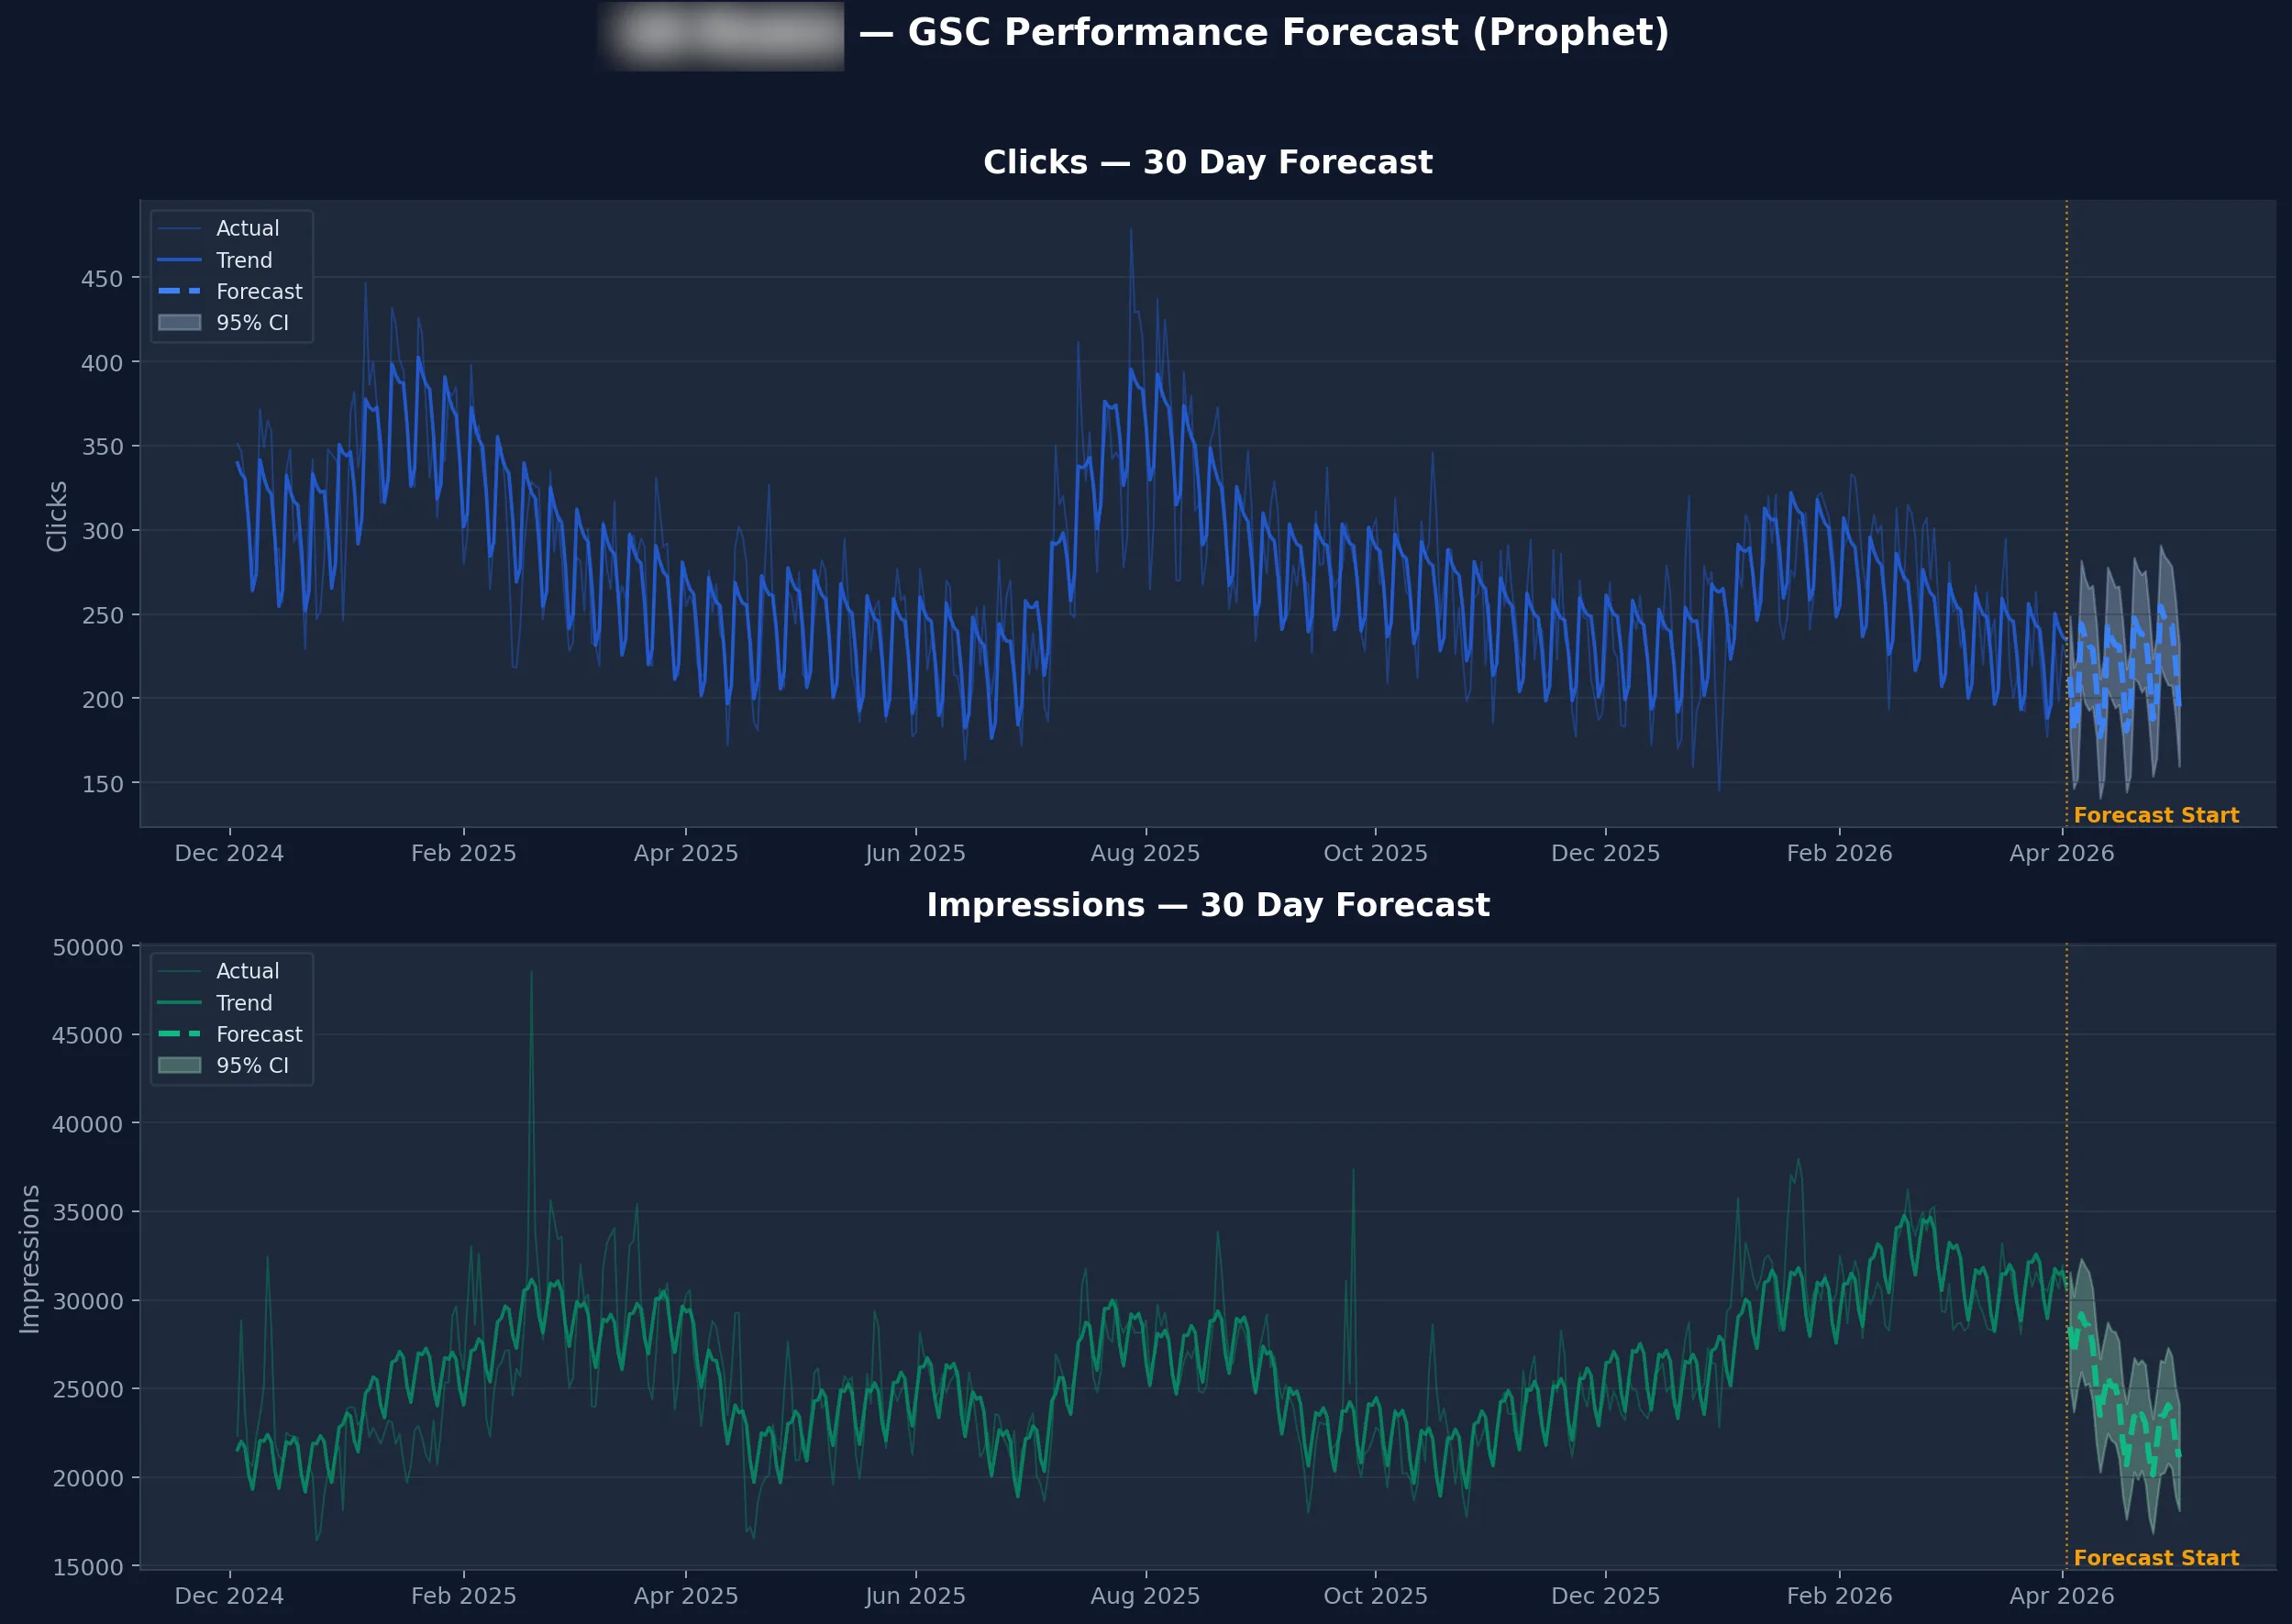
The site is a B2C services business with clear weekday/weekend traffic patterns and a visible downtrend over the past few months. Impressions have been growing (22k to 35k daily), positions improved (from 18 down to 7), but clicks keep declining. Classic CTR compression from AI Overviews eating the SERP.
486 days of daily click data. 30 day prediction window. 3 forecasting methods.
Claude’s estimate (no tools, just the LLM)
I gave Claude the raw data and told it not to use any tools. Just look at the numbers and estimate.
Based on this traffic data, what do you think my clicks will look like next month? Don’t use any tools, just estimate based on the numbers.
It came back with 6,700 to 7,200 total clicks for the next 30 days, roughly 216 to 232 per day.
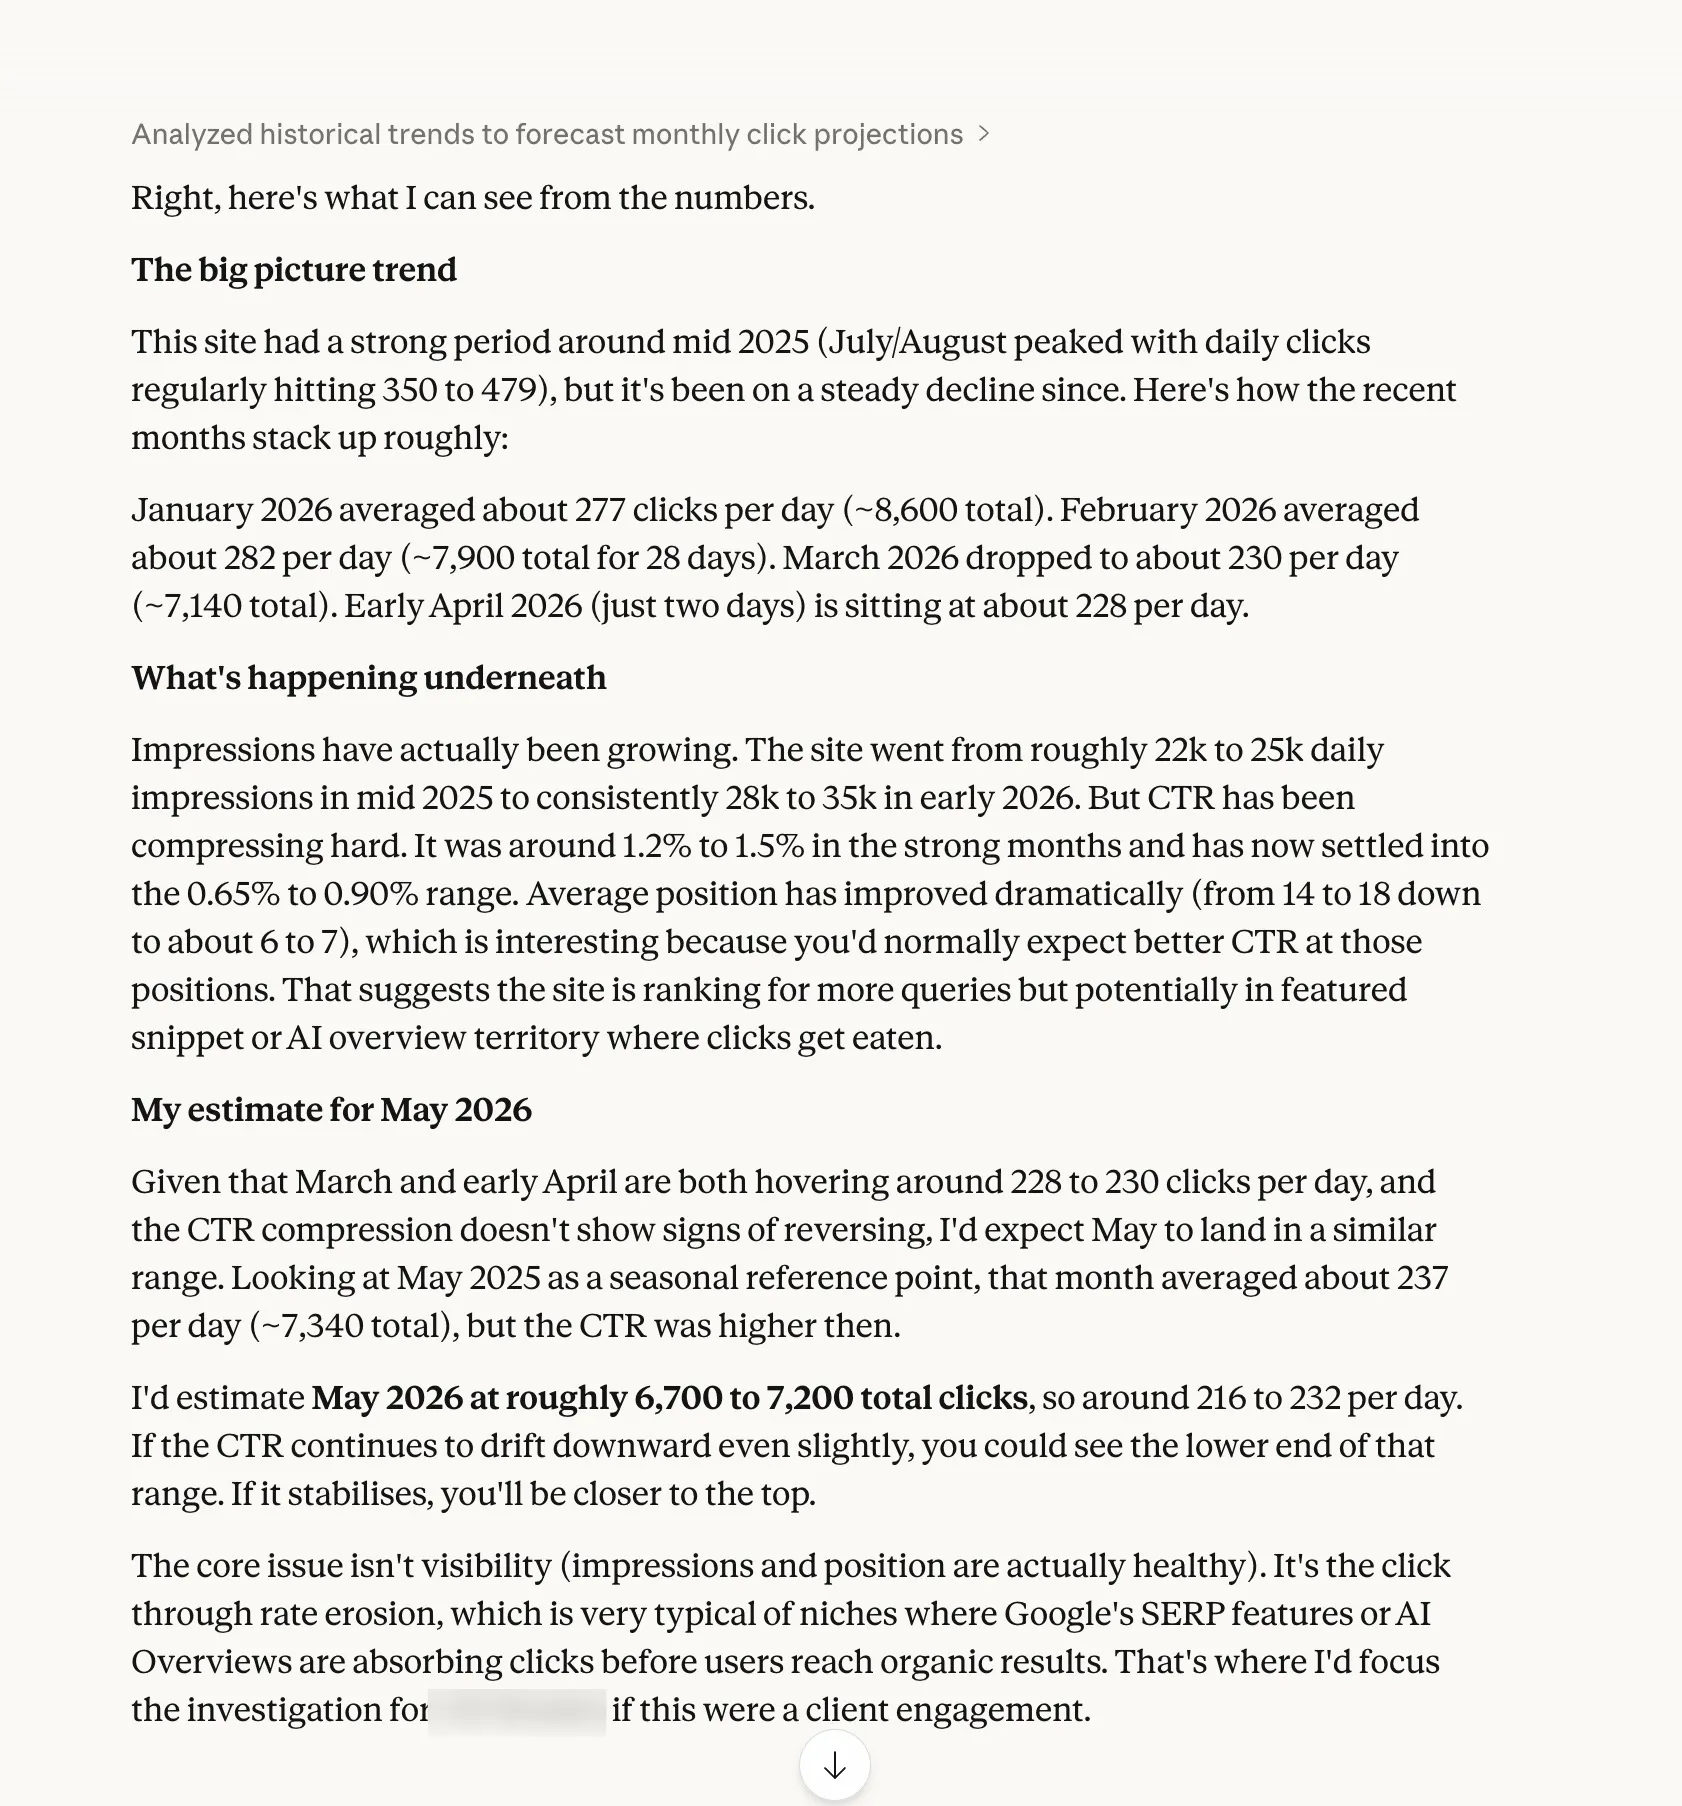
The interesting part wasn’t the number. It was everything else. Claude spotted the CTR compression, noticed that impressions were growing while clicks declined, identified the seasonal weekday pattern, and flagged that positions had improved from 18 to 7 without a corresponding click increase. It diagnosed the cause as AI Overviews absorbing clicks before users reach organic results.
No statistical model can tell you why traffic is declining. Claude did. But “the AI reckons about 7,000” doesn’t inspire confidence in a client forecast.
ARIMA (the textbook approach)
ARIMA is the traditional forecasting method. BigQuery’s ARIMA_PLUS model uses it under the hood. It’s the go-to for time series analysis in data science, and the benchmark I wanted to test Prophet against.
I ran Auto-ARIMA with weekly seasonality on the same dataset. It selected ARIMA(4,1,3) with seasonal order (0,0,1,7), which tells you it found a weekly pattern and a downtrend.
6,354 total clicks. 212 per day average. The most pessimistic of the 3.
The confidence bands were massive. The 95% interval ranged from 123 to 300 clicks per day. That’s a spread so wide you could drive a lorry through it. Useful for confirming the general direction, less useful for planning anything specific.
ARIMA also gives you zero context about why the trend exists, no weekly seasonality breakdown, and no way to see which days of the week perform best. It’s a pure numbers machine.
Prophet (Meta’s forecasting library)
Prophet was built by Meta’s data science team for business metrics. Weekly cycles, seasonal trends, the occasional weird spike. SEO traffic fits that description perfectly.
6,588 total clicks. 220 per day average.
Prophet’s confidence band was much tighter than ARIMA. The 95% interval sat between 183 and 256 daily clicks, a 34% narrower range. It also decomposed the weekly seasonality into specific numbers. Mondays add +27 clicks above average. Saturdays drop -40. The weekday pattern tapered from Monday through Thursday, with Friday sitting just below the mean.
That weekly breakdown is genuinely useful.
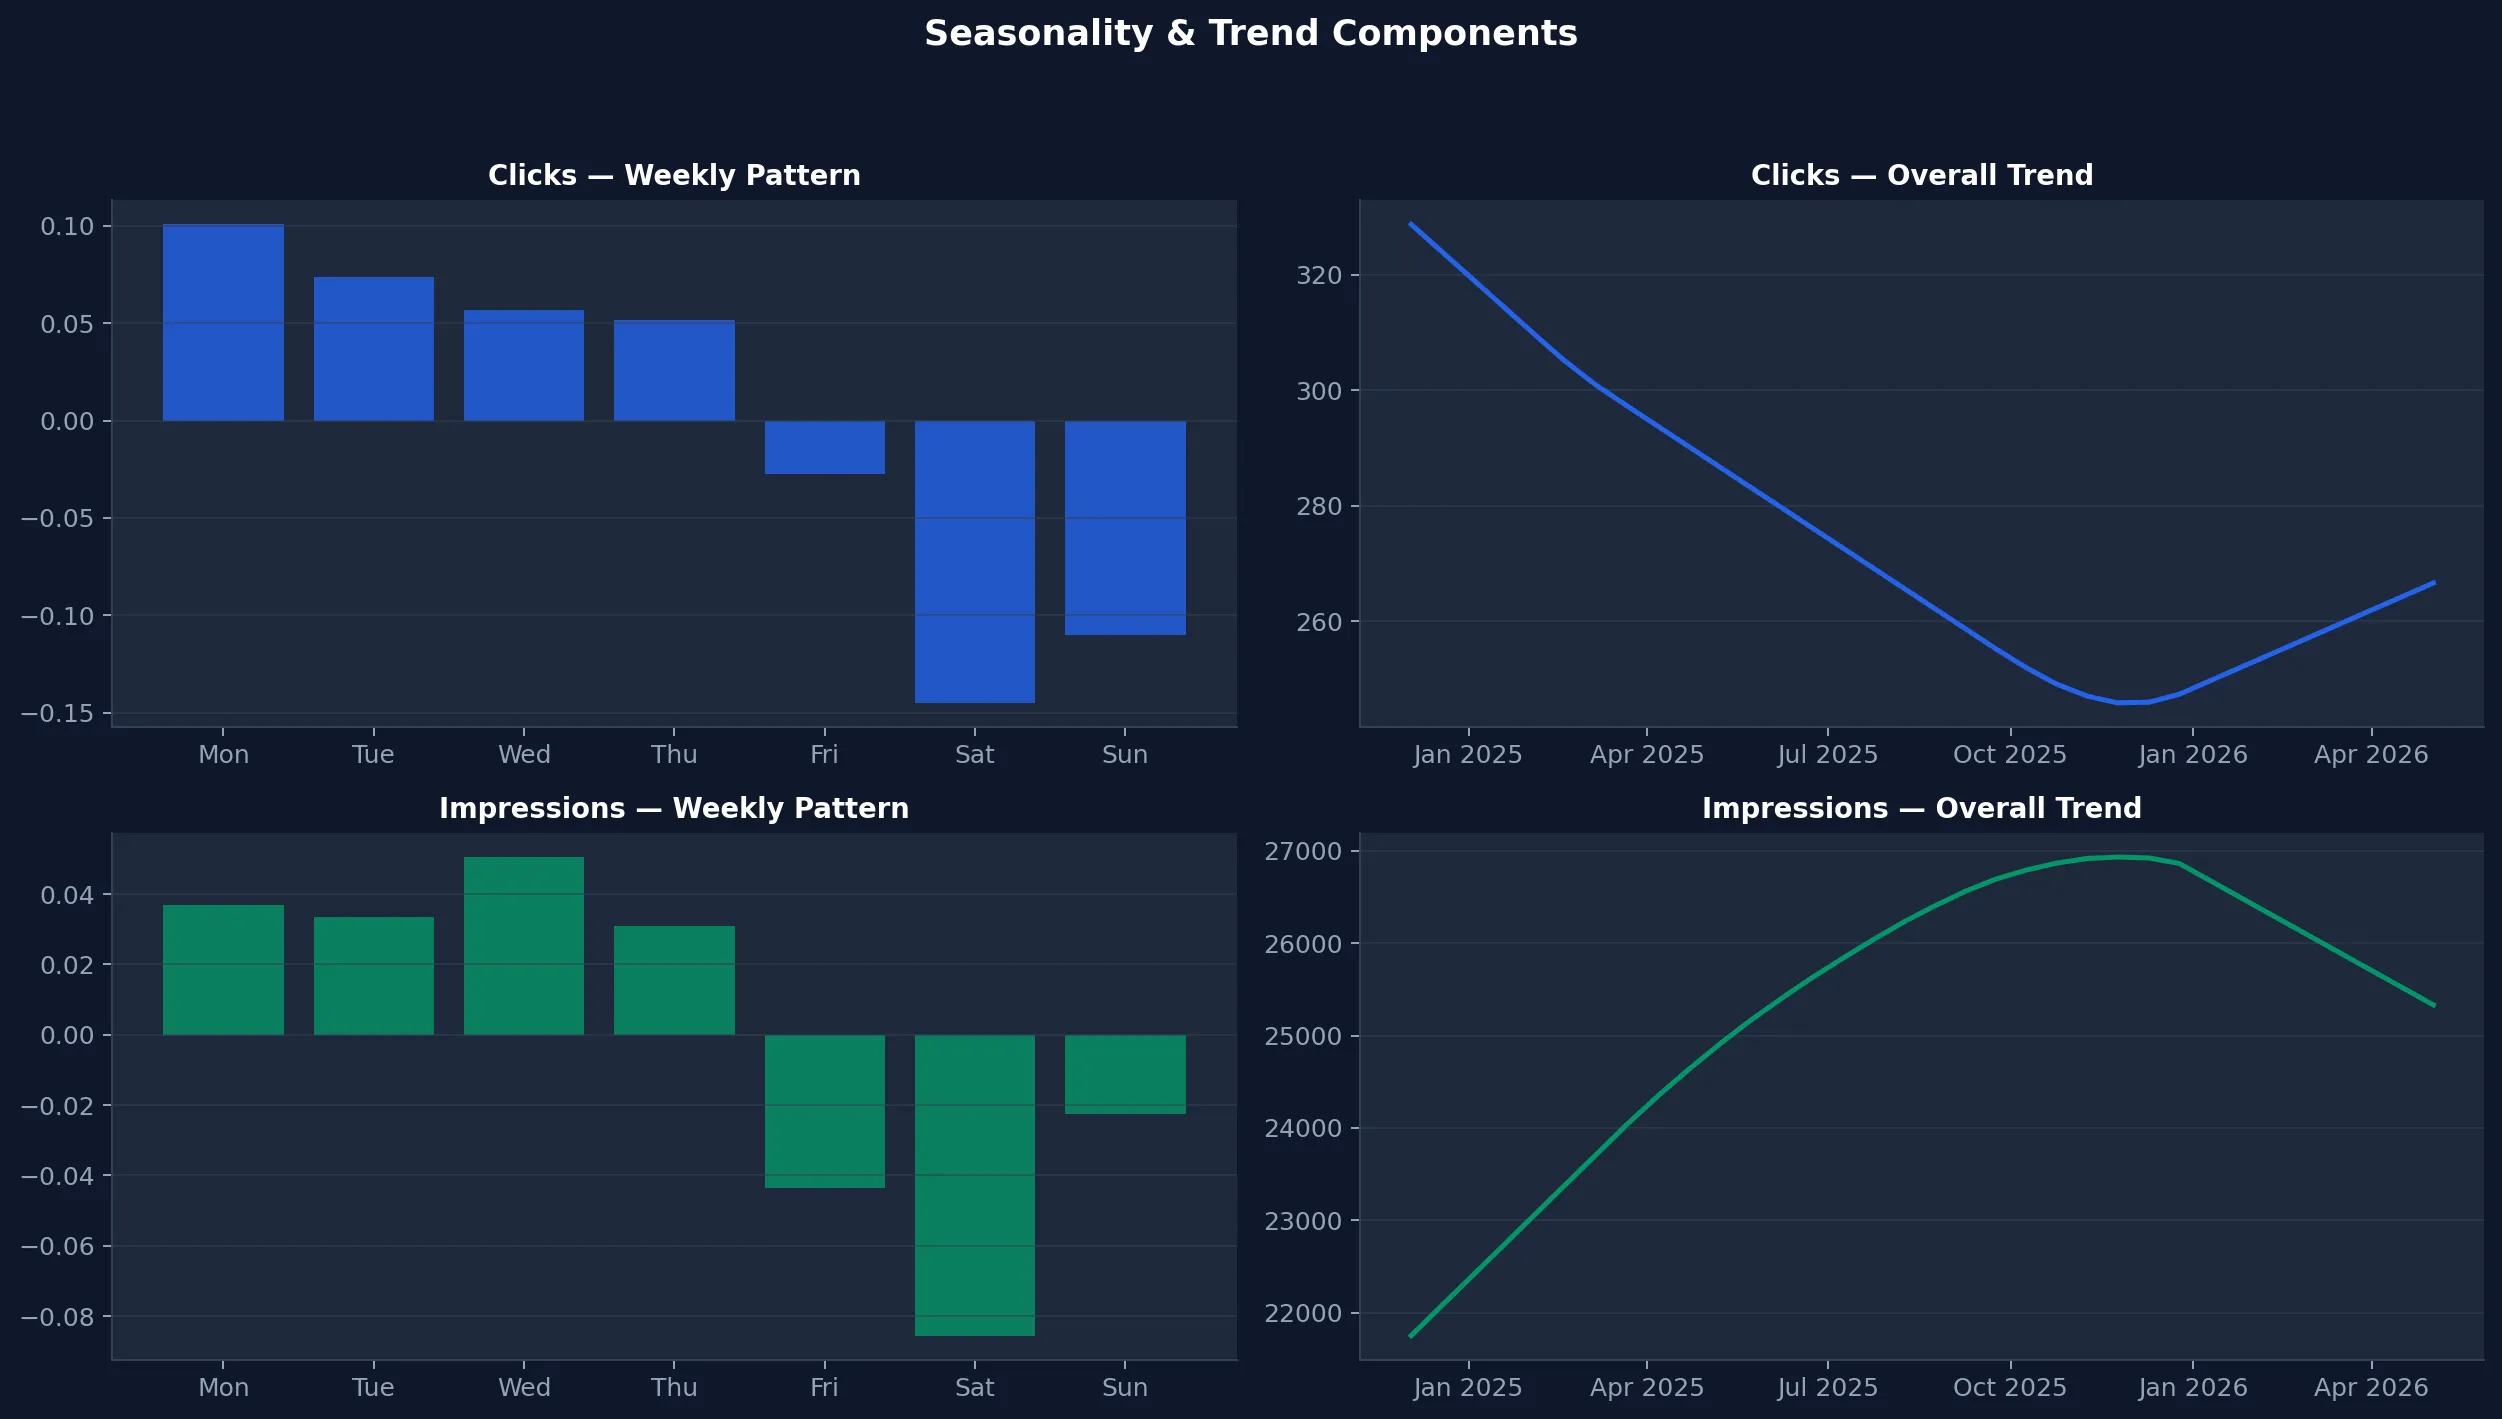
If you’re scheduling content updates or planning link building outreach, knowing your best traffic days matters.
The 3 way comparison
All 3 methods landed within 10% of each other on the headline number. That was the first surprise.
| Claude (LLM) | ARIMA | Prophet | |
|---|---|---|---|
| 30 day total | 6,700 to 7,200 | 6,354 | 6,588 |
| Daily average | 216 to 232 | 212 | 220 |
| Confidence interval | Informal range | 123 to 300 (wide) | 183 to 256 (tight) |
| Weekly seasonality | Mentioned in passing | Not available | Quantified per day |
| Qualitative context | CTR compression, AI Overviews, position trends | None | None |
| Setup | Already have it | BigQuery ML or pmdarima | 1 MCP server |
| Cost | Claude subscription | BigQuery compute | BigQuery compute |
ARIMA is the benchmark here, not a recommendation. It proves that Prophet holds up against the traditional statistical method, with tighter confidence bands and weekly seasonality on top.
Claude was the most optimistic and the only one that explained the underlying dynamics. The CTR compression, the AI Overviews diagnosis, the growing impressions despite declining clicks. No amount of statistical modelling surfaces that. But you can’t put “Claude thinks maybe 7,000” in a client report. You need numbers with confidence intervals.
The answer isn’t to pick one. Prophet handles the maths. Claude handles the thinking. Wire them together through MCP and you get both.
What this actually means for SEO forecasting
Before this test, I assumed statistical models would blow Claude’s estimate out of the water. They didn’t. All 3 landed within 10% on the headline number. The difference isn’t accuracy. It’s what you get around the number.
If you’re doing quarterly forecasts for clients, you can’t hand over “Claude reckons about 7,000 clicks.” You need a predicted value, a confidence interval, and a weekly breakdown they can plan around. Prophet gives you that. 6,588 clicks, 95% confidence between 183 and 256 per day, Mondays strongest, Saturdays weakest. That’s a slide in a deck, not a guess in a chat window.
If you’re trying to figure out whether a traffic drop is seasonal or structural, Prophet alone won’t tell you. It sees the downtrend. It doesn’t see that impressions are growing, positions are improving, and CTR is compressing because AI Overviews are absorbing clicks above your organic listings. Claude sees that. In the test, Claude identified the exact cause of the decline without being prompted to look for it.
If you’re planning a content calendar, Prophet’s weekly seasonality tells you which days your audience actually shows up. Knowing Mondays add +27 clicks and Saturdays lose -40 changes when you publish, when you promote, and when you schedule outreach.
None of these tools covers the full picture alone. That’s the whole point of the MCP server. You ask Claude one question, it pulls your GSC data through one MCP server, runs Prophet through another, and gives you statistical rigour wrapped in context you can act on. One prompt, two tools chaining together, both jobs done properly.
ARIMA proved the maths holds up. Prophet does the same job with tighter confidence bands, weekly seasonality, and zero setup friction. Claude adds the layer that no model can. The MCP server is the glue.
What is Prophet?
Prophet is a forecasting library built by Meta’s data science team. It does 3 things that matter for SEO.
Trend detection
A mathematically computed trend line with a confidence interval. Not “I think it’s going up” but a specific growth or decline rate over a defined period.
Weekly seasonality
The exact contribution of each day of the week to your traffic. Mondays +27, Saturdays -40. Those numbers come from the data, not from intuition.
Confidence intervals
Instead of a single predicted number, Prophet gives you a range. “Between 183 and 256 clicks on this day, with 95% confidence.” Anyone giving you a single number without bounds is selling you certainty that doesn’t exist.
Prophet runs locally. No cloud service, no API costs, no sending your data anywhere, no GPU. It runs in under 2 seconds on a laptop.
Setup guide
What you need
- Claude Desktop. Download from claude.ai if you don’t have it.
- Python 3.8 or higher. Most Macs have this. Run
python3 --versionin Terminal to check. Windows users, grab it from python.org. - GSC data. The GSC MCP server, the BigQuery MCP server, or a CSV export from Google Search Console.
Step 1. Install the dependencies
Open Terminal (Mac) or Command Prompt (Windows) and run this.
pip3 install prophet mcp pandasTakes about a minute. Prophet pulls in Stan (the statistical computing engine) as a dependency. If you see “Successfully installed” at the end, you’re good.
Step 2. Download the Prophet MCP server
git clone https://github.com/Suganthan-Mohanadasan/prophet-mcp-server.gitOr download the zip from github.com/Suganthan-Mohanadasan/prophet-mcp-server and unzip it. Your Downloads folder works fine. The only file that matters is server.py.
Step 3. Connect it to Claude Desktop
Open Claude Desktop, go to Settings, click Developer, then Edit Config.
On Mac
{
  "mcpServers": {
    "prophet-forecast": {
      "command": "python3",
      "args": ["/Users/yourname/Downloads/prophet-mcp-server/server.py"]
    }
  }
}
On Windows
{
  "mcpServers": {
    "prophet-forecast": {
      "command": "python",
      "args": ["C:\\Users\\yourname\\Downloads\\prophet-mcp-server\\server.py"]
    }
  }
}
Replace the path with wherever you saved server.py. Needs to be the full absolute path.
If you already have other MCP servers configured, add the prophet-forecast entry alongside them inside the existing mcpServers object.
Save the file and restart Claude Desktop.
Step 4. Verify it’s connected
Go to Settings, then Developer. You should see prophet-forecast in the list of Local MCP servers with a running badge. Click on it to confirm the command is python3 and the arguments point to your server.py file.
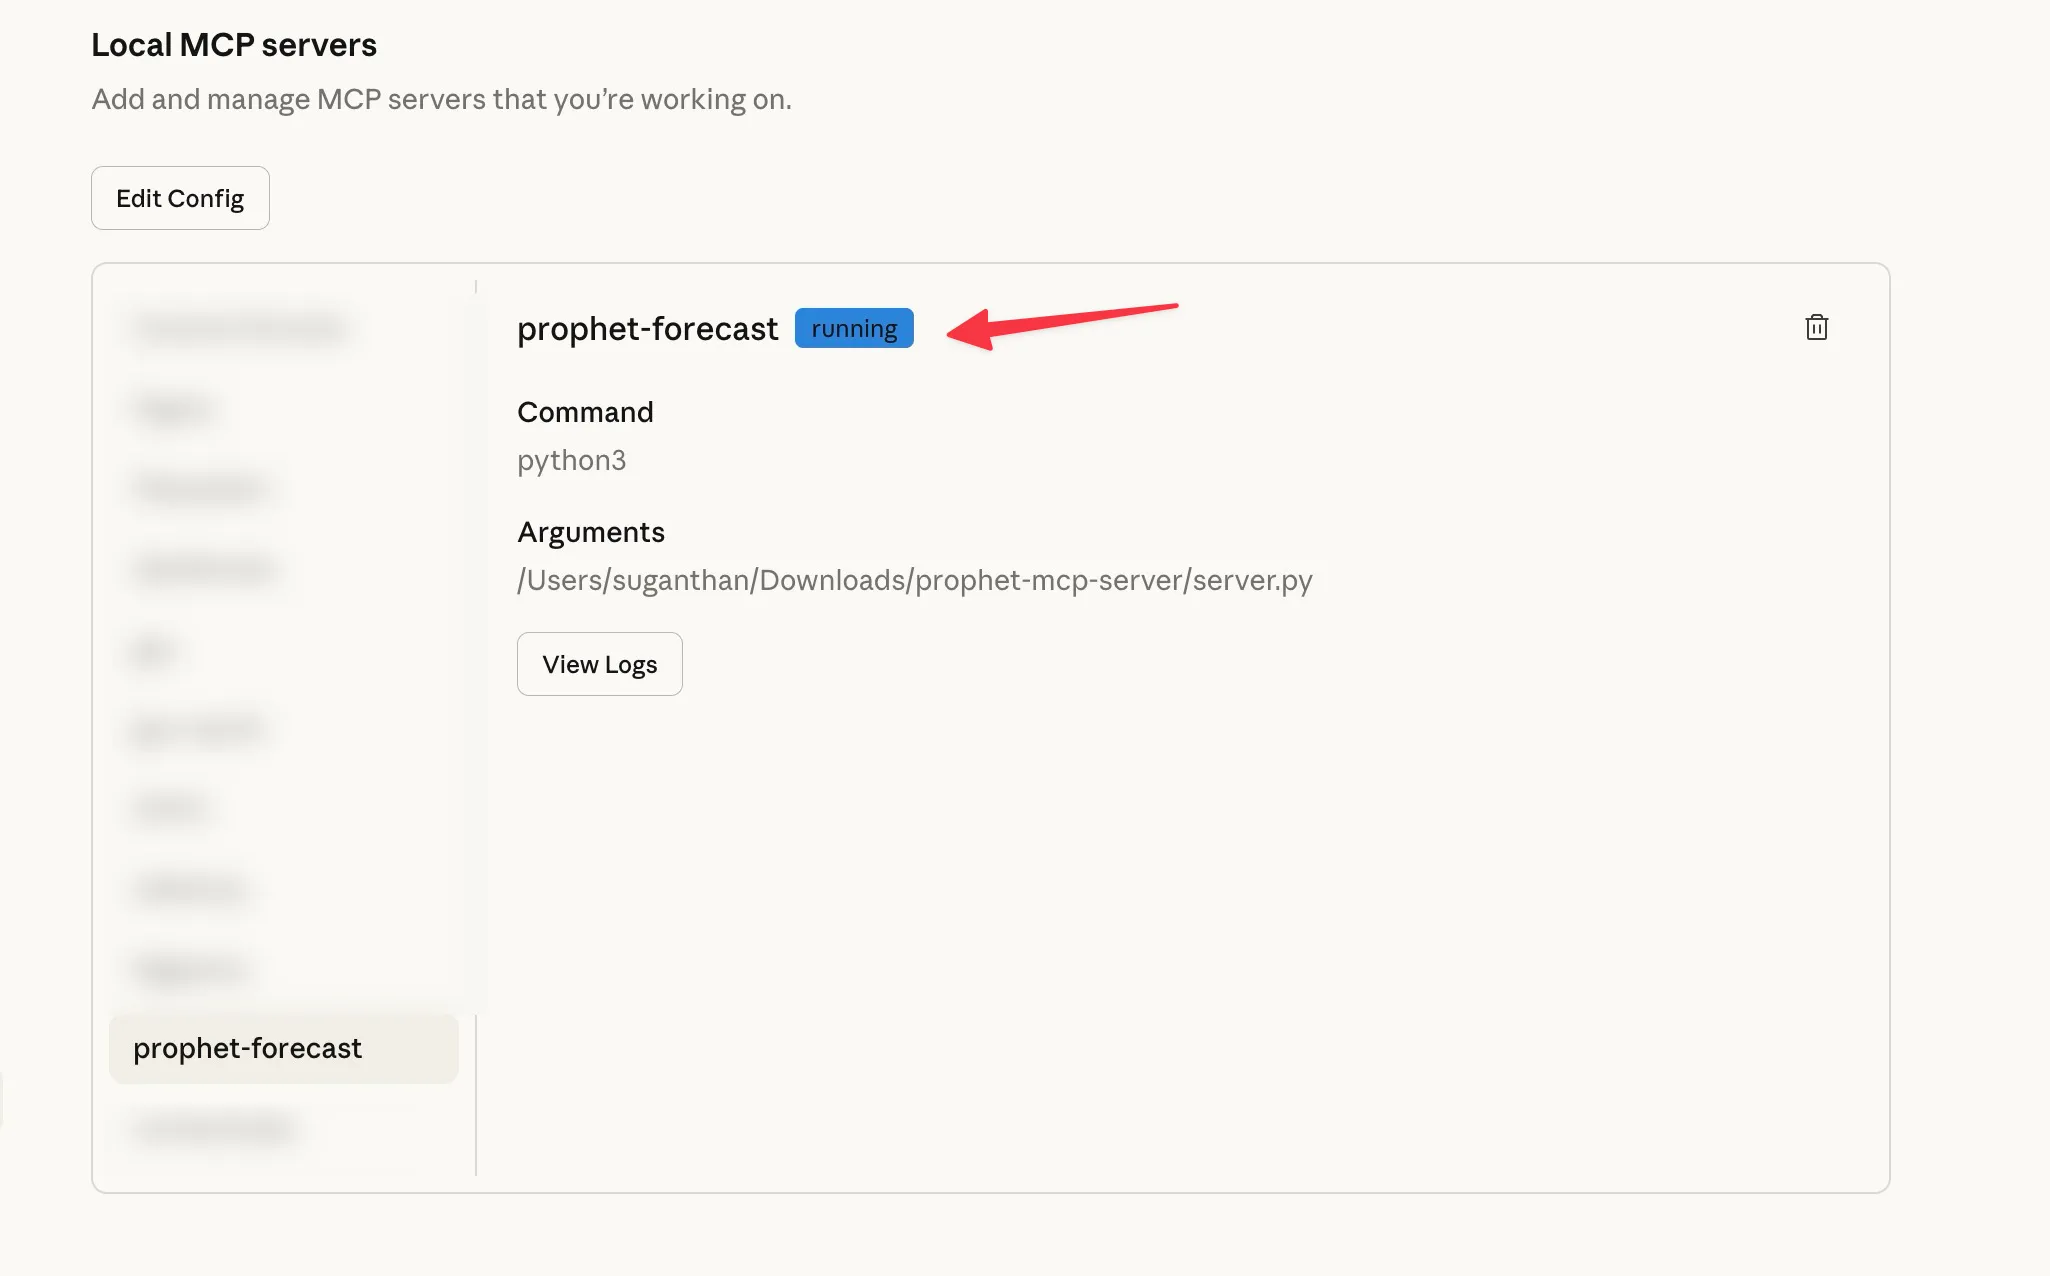
2 tools are now available to Claude.
forecast_traffic takes dates and values directly. Claude uses this when it already has your data from another MCP server. You won’t call this tool yourself. Claude calls it automatically when you ask it to forecast data it has already pulled.
forecast_from_csv reads a CSV file from your computer. Use this when you have a GSC export or any spreadsheet with dates and numbers.
Run your first forecast
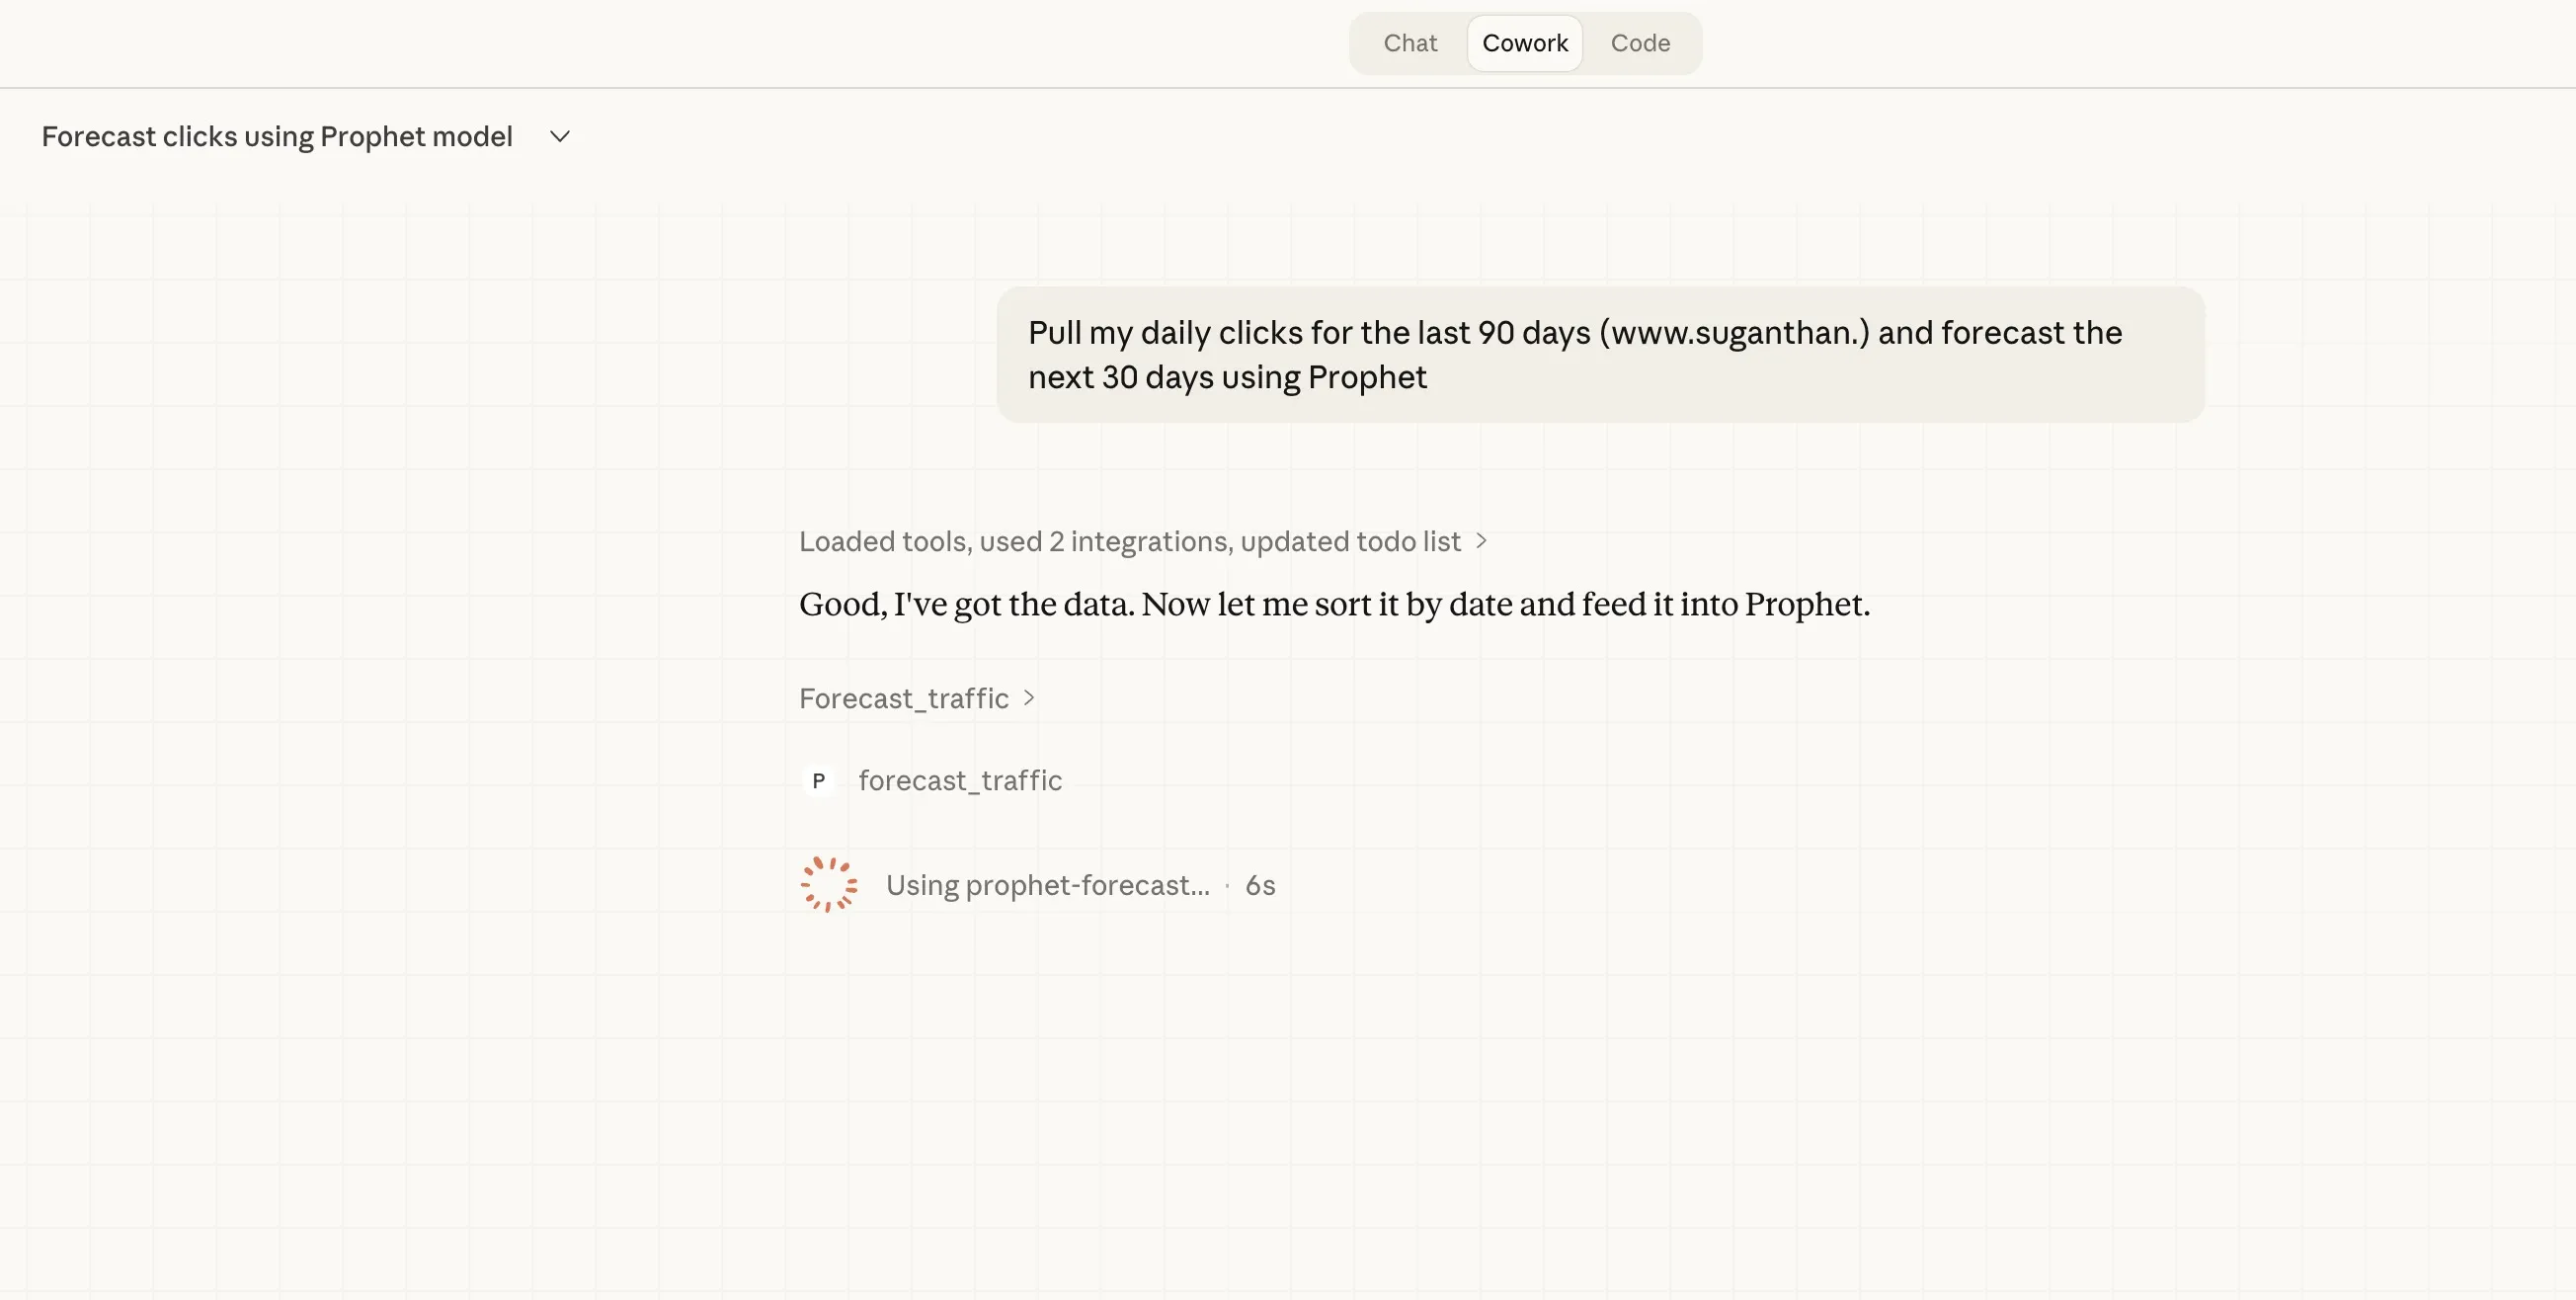
If you have the GSC MCP server or BigQuery MCP server connected alongside Prophet, Claude chains them together automatically. One server pulls the data, the other runs the forecast.
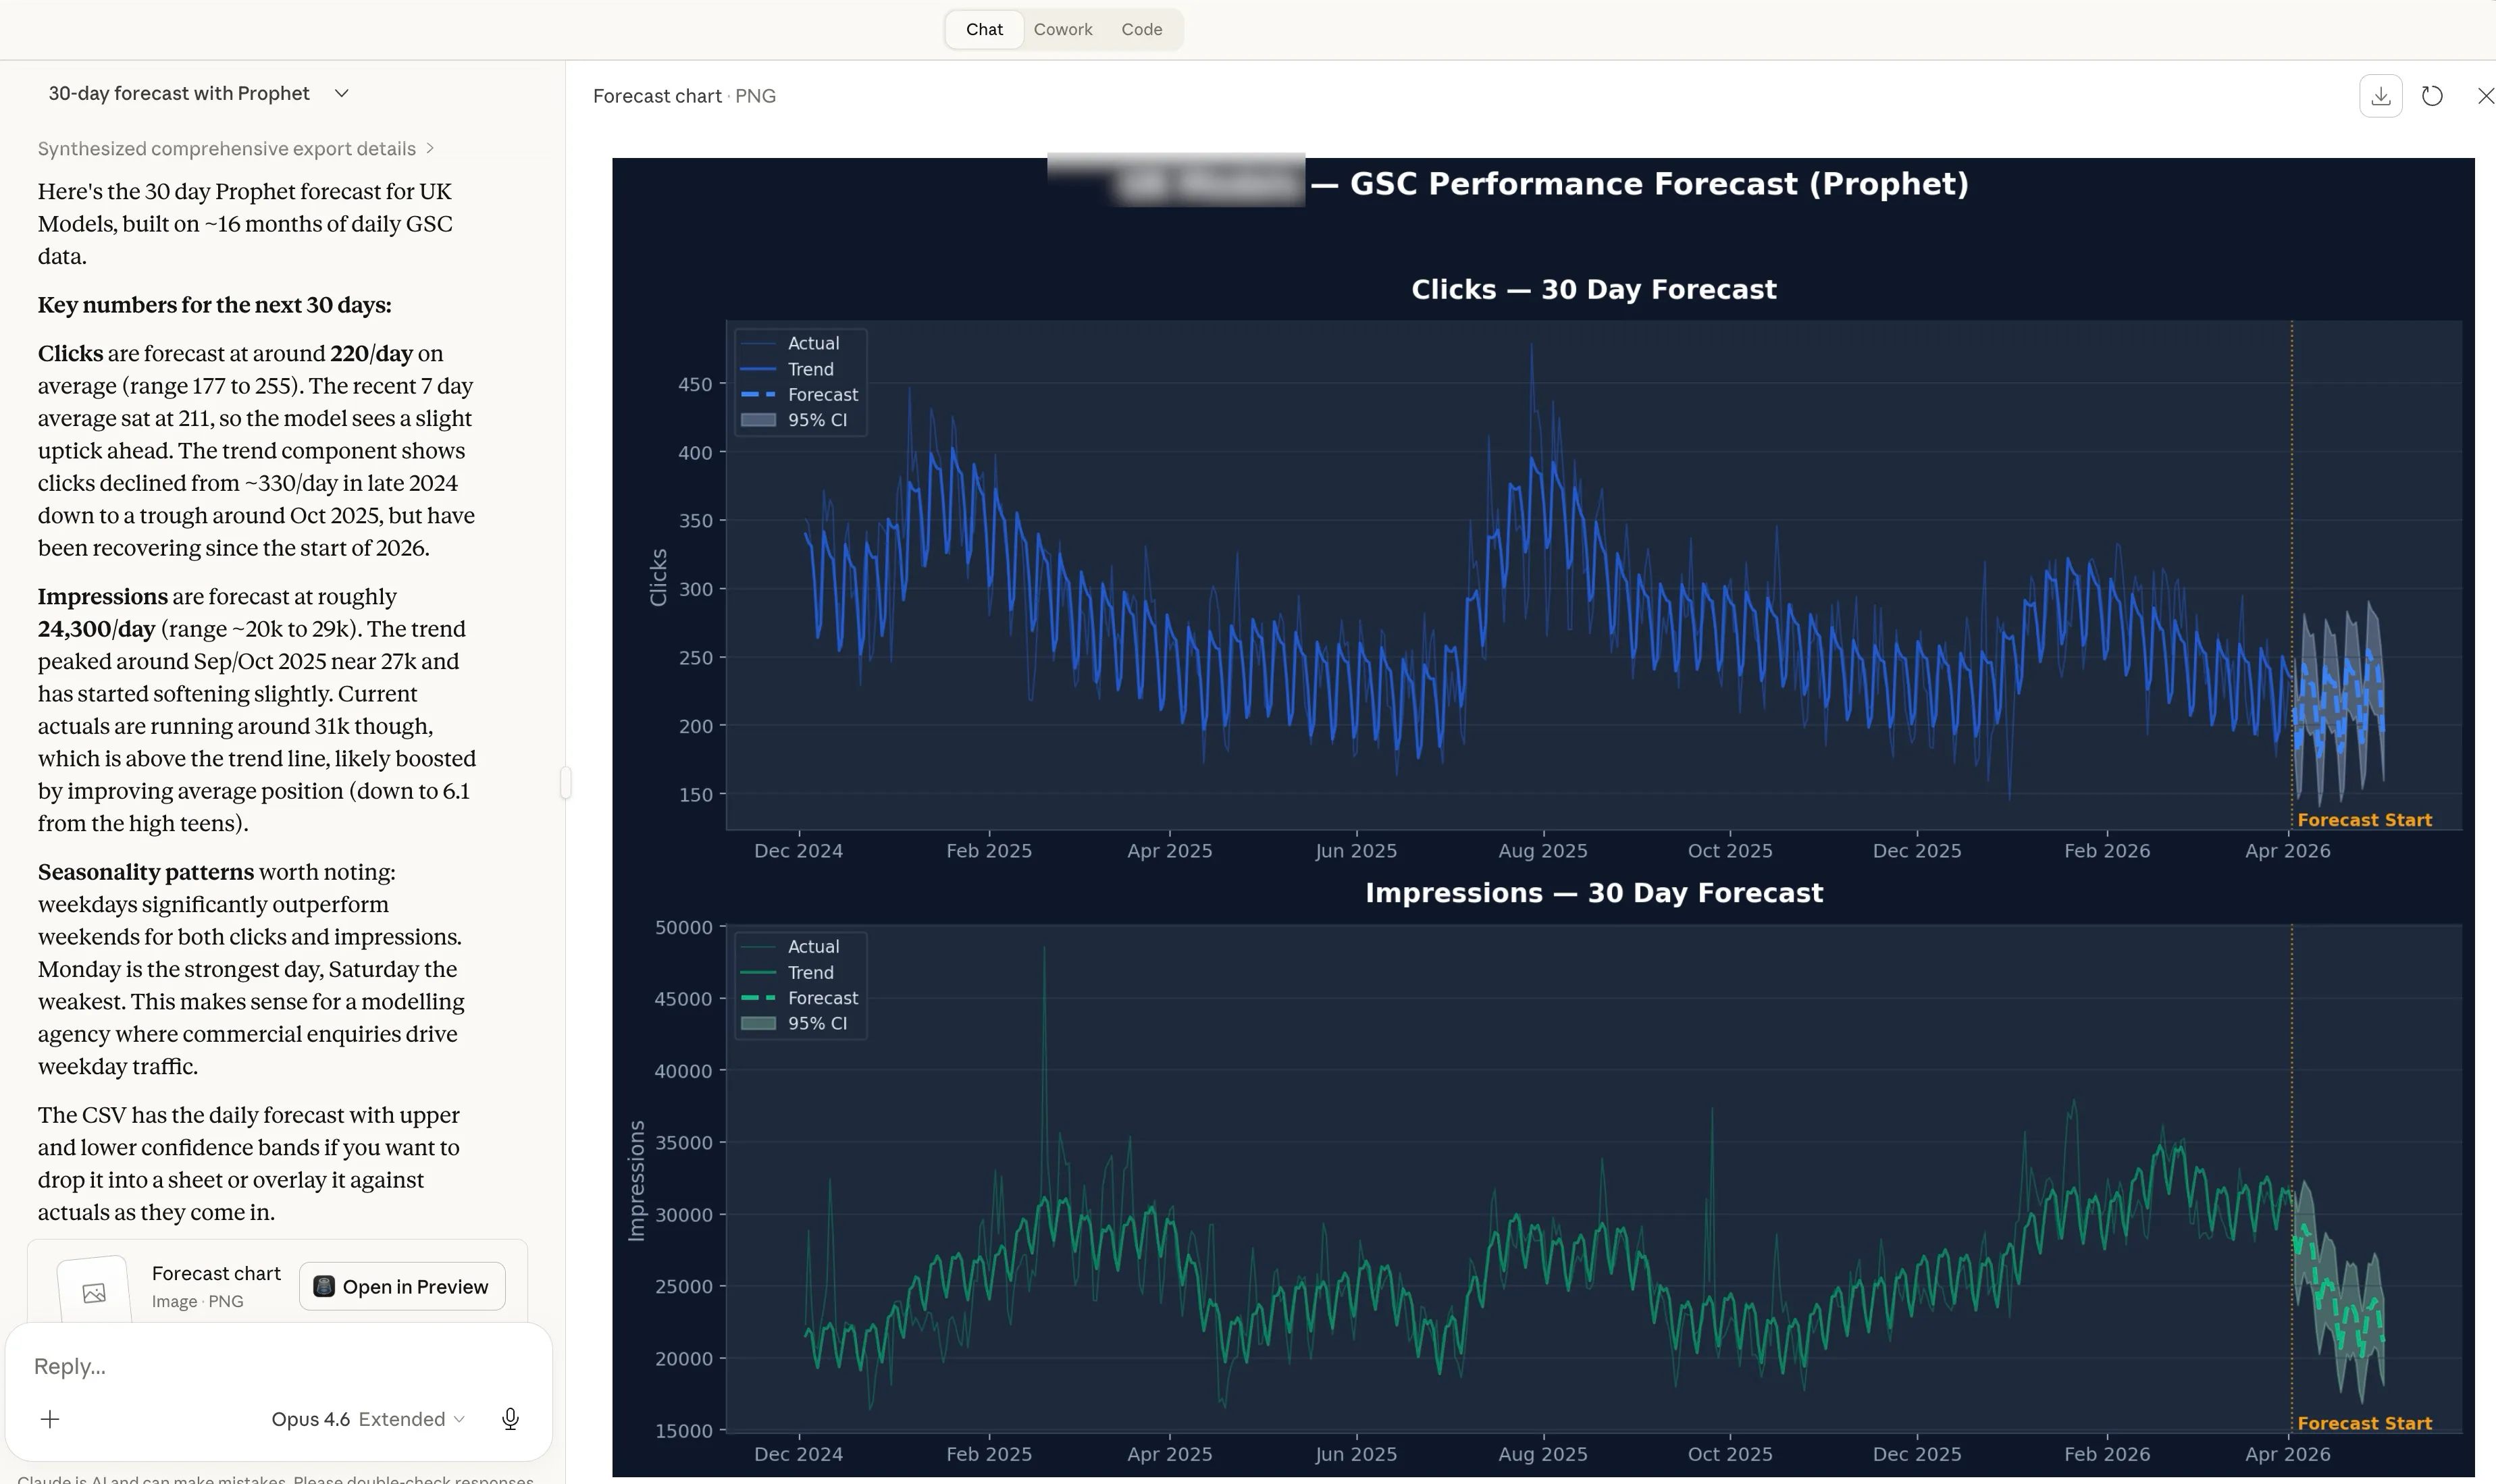
Pull my daily clicks for the last 90 days and forecast the next 30 days using Prophet
The key is including “using Prophet” so Claude routes the computation to the Prophet MCP server instead of trying to estimate the numbers itself.
Here’s what you get back.
Trend summary. Whether your traffic is trending up or down, by how much, and your current 7 day average versus what Prophet predicts for the next period.
Daily forecast. Every day for the next 30 days with a predicted value, a lower bound, and an upper bound. The range between lower and upper is your confidence interval. Wider ranges mean more uncertainty, which is honest and useful.
Weekly seasonality. Which day of the week performs best and which performs worst. If your content gets more traffic on weekdays than weekends, you’ll see exactly how much.
Using a CSV export instead
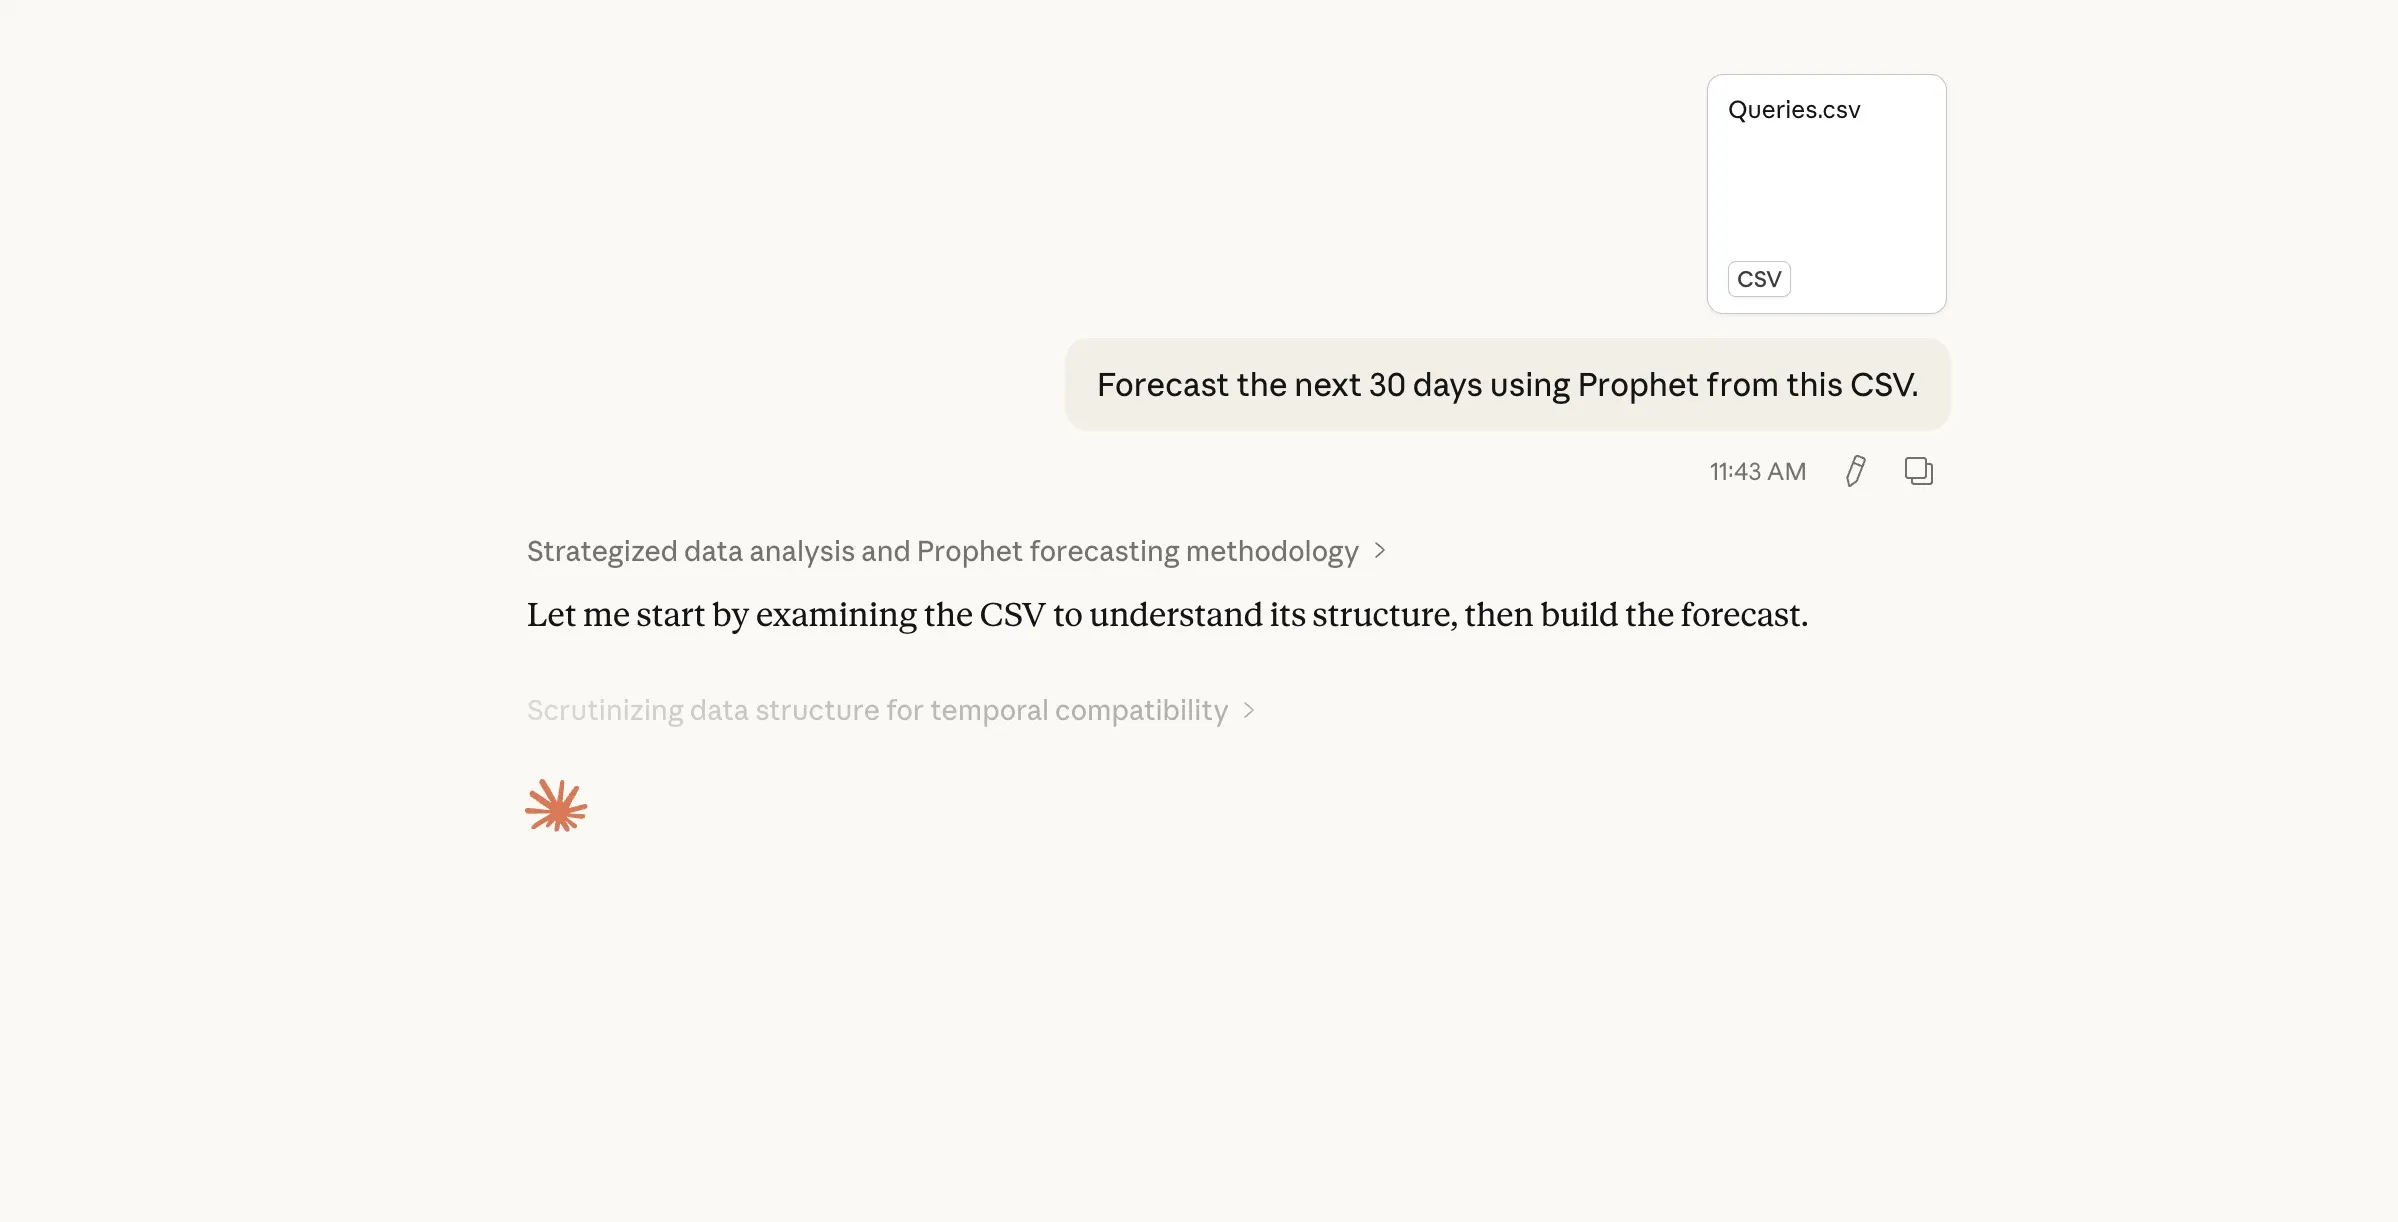
No GSC MCP server? No problem.
Go to Google Search Console, click Performance, set your date range, then click Export and choose Google Sheets. This part is important. If you export directly as CSV you get a ZIP file with individual CSV files and you need them all under a single file with dates. Without dates the forecast won’t work. So export as Google Sheets first, open it, then download as CSV. This way you get a single file with dates and clicks in the right format. After that, attach it to Claude.
Forecast the next 30 days using Prophet from this CSV
The forecast_from_csv tool auto-detects date and value columns.
Try it with different metrics
Clicks aren’t the only thing worth forecasting.
Pull my daily impressions for the last 90 days and forecast the next 90 days using Prophet
Forecasting impressions can reveal whether your visibility is growing even when clicks haven’t caught up. A gap between rising impressions and flat clicks usually means your rankings are improving but SERP features or AI Overviews are eating the clicks before users reach organic results. That’s exactly what I found with the test site.
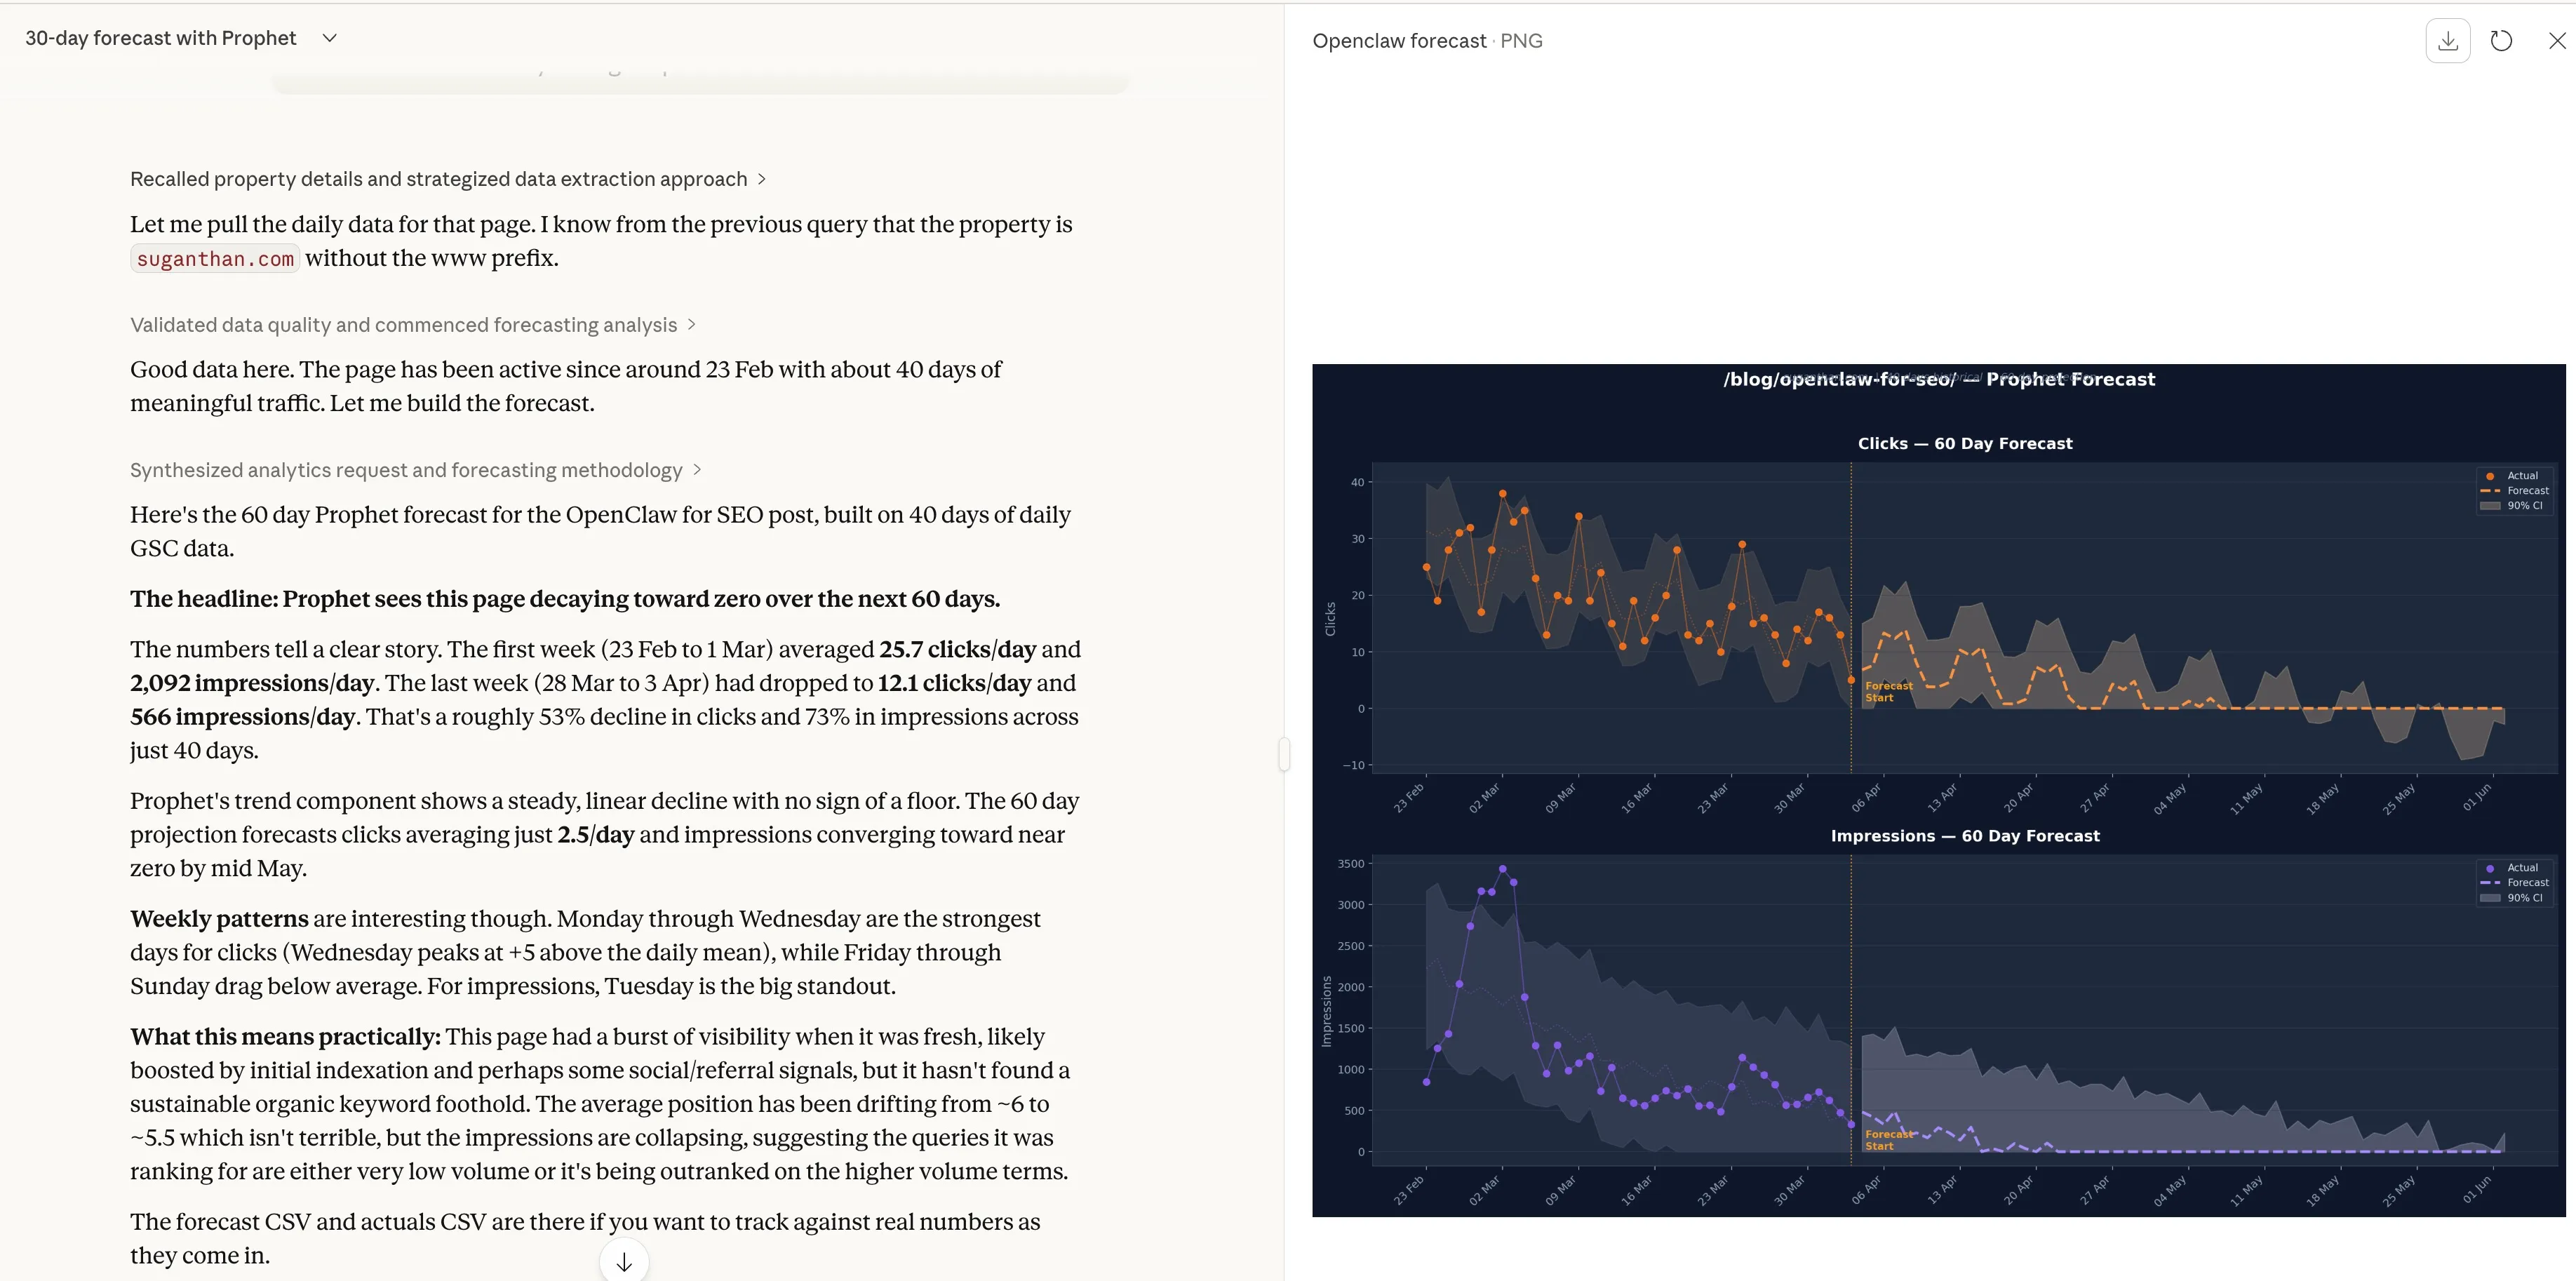
Pull daily clicks for just /blog/openclaw-for-seo/ for the last 90 days and forecast the next 60 days using Prophet
Page level forecasting helps you decide which content to update or whether a new post is gaining traction.
Result
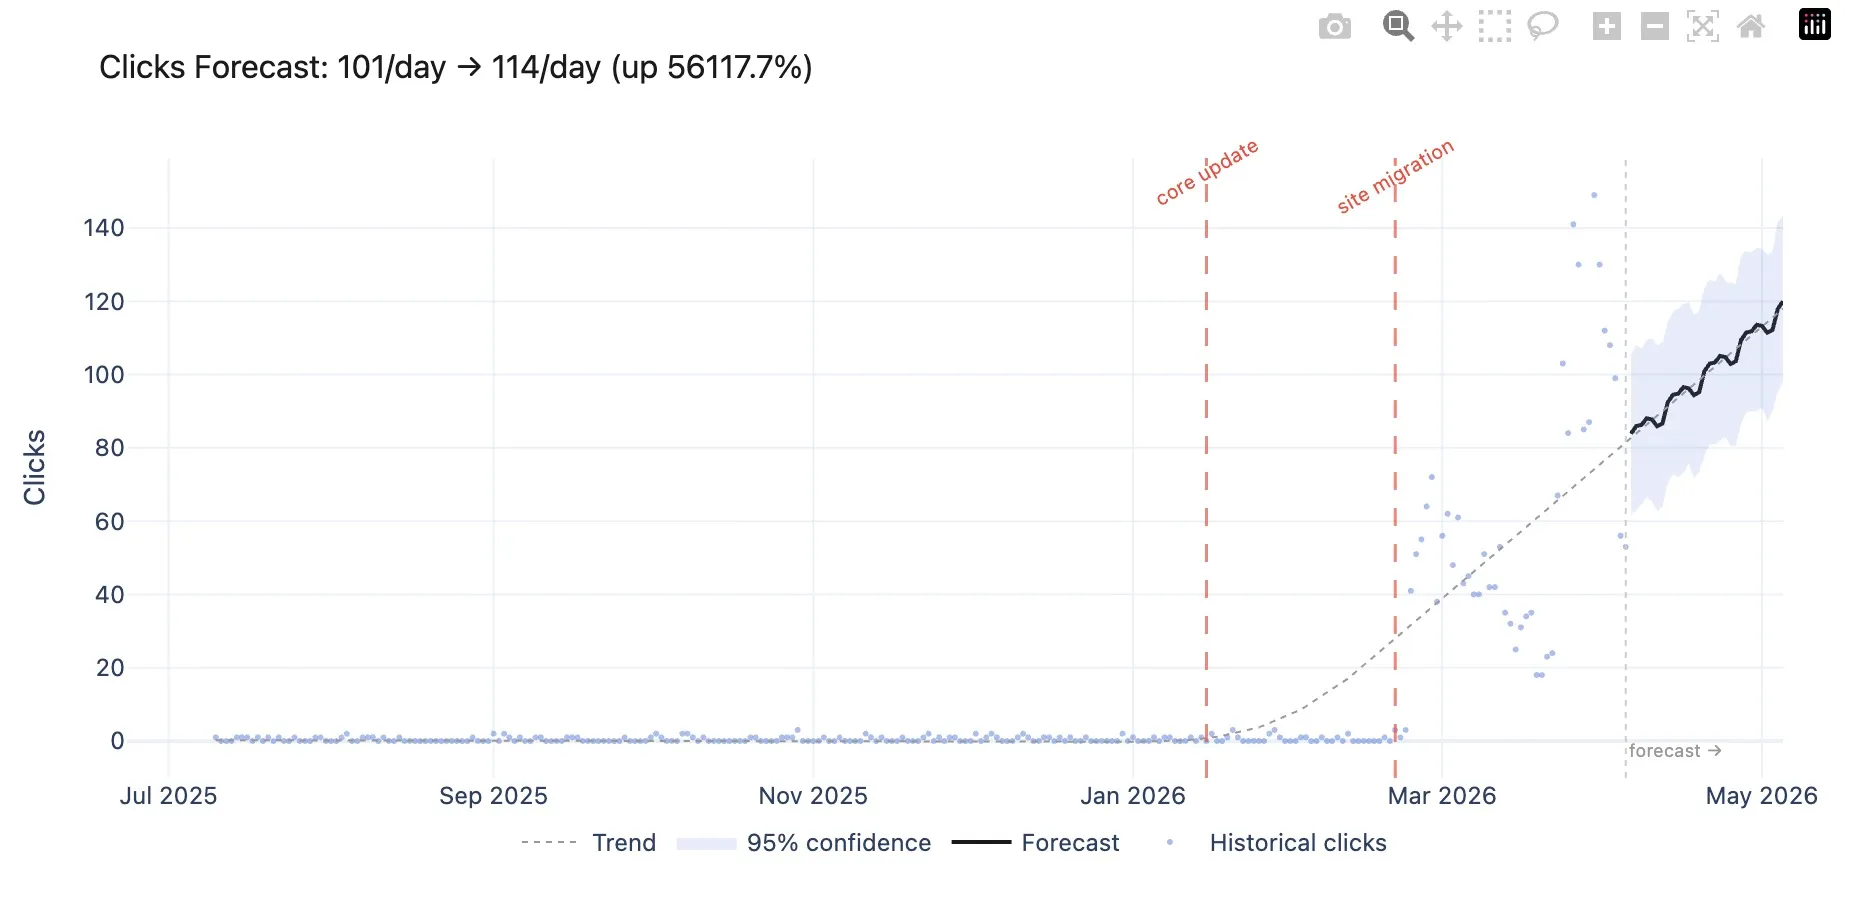
Event annotations (new)
Prophet now accepts event annotations. Algorithm updates, site migrations, content launches, redirects. Anything that caused a traffic spike or dip.
This isn’t cosmetic. Prophet treats these as special events in the statistical model. Instead of a migration-related traffic drop bleeding into your baseline trend, the model isolates it. Your forecast gets cleaner because Prophet knows the difference between organic decline and a one-off event.
Forecast my daily clicks for the next 30 days using Prophet with these events: core update on 2026-01-15 with 14 day window, site migration on 2026-02-20 with 21 day window
Each event accepts a date, a label, and optional window parameters for how many days before and after the event it may have had impact. You can also load events from a CSV file if you have a lot of them.
Interactive charts (new)
The forecast_chart tool generates an interactive Plotly chart saved as an HTML file. It opens automatically in your browser.
Create a Prophet forecast chart for my daily clicks over the next 60 days
The chart includes historical data as scatter points, the forecast line with a shaded 95% confidence band, a dotted trend line, and red vertical markers for any event annotations. You can hover for exact values, zoom into specific date ranges, and download it as a PNG for client decks.
Get started
- Install the dependencies with
pip3 install prophet mcp pandas plotly - Download the Prophet MCP server from GitHub
- Add it to your Claude Desktop config
- Ask Claude to forecast your traffic
If you’re already using my GSC MCP server or BigQuery MCP server, this plugs right in. If you’re not, a CSV export from Google Search Console works just as well.
The Prophet MCP server is open source and available on GitHub. Credit to Joshua Squires for the comment that sparked the idea.
Changelog
v1.1.0 Event annotations and interactive Plotly charts. Annotations feed into Prophet as statistical regressors, isolating event-driven changes (algo updates, migrations, launches) from organic trends for cleaner forecasts. New forecast_chart tool generates interactive HTML visualisations with historical scatter, forecast line, 95% confidence band, trend line, and event markers. Events can be passed inline or loaded from a CSV. Thanks to Joshua Squires for the suggestions.
v1.0.0 Initial release with forecast_traffic and forecast_from_csv. Trend detection, 95% confidence intervals, weekly seasonality breakdown. Runs locally on Meta’s Prophet, no cloud services.
You might also like
Stay in the loop
I'll email you when I publish something new. No spam. No fluff.
Join other readers. Unsubscribe anytime.

Entrepreneur & Search Journey Optimisation Consultant. Co-founder of Keyword Insights and Snippet Digital.